Project Overview
TrackGraph Observability is the infrastructure-as-code backbone behind the TrackGraph web app. The stack provisions every AWS service needed for app delivery and end-to-end telemetry using Pulumi with Python. It deploys the production backend on App Runner, instruments it with OpenTelemetry, and funnels traces, metrics, and logs into managed observability services so feature work ships with real feedback loops.
Why Build an Observability Plane?
I wanted to treat the TrackGraph app like a production system: infrastructure defined in code, repeatable deployments, and telemetry that answers why something happened. Standing up an AWS-native stack forced me to learn how modern teams wire traces, metrics, and logs together, and how to validate that the data I'm collecting is trustworthy before anything breaks in production.
Technologies Used
- Pulumi (Python)
- AWS App Runner
- Amazon Managed Prometheus (AMP)
- Amazon Managed Grafana
- AWS Lambda & CloudWatch
- AWS CloudFront & S3
- AWS Secrets Manager
- OpenTelemetry / ADOT collectors
- GitHub Actions CI
Key Outcomes
- Containerized backend with trace instrumentation deployed via App Runner
- Prometheus metrics pipeline with managed collectors and Grafana dashboards
- Serverless log enrichment converting CloudFront logs into actionable metrics
- Repeatable Pulumi stack that mirrors production defaults but can target any AWS account
Stack Components
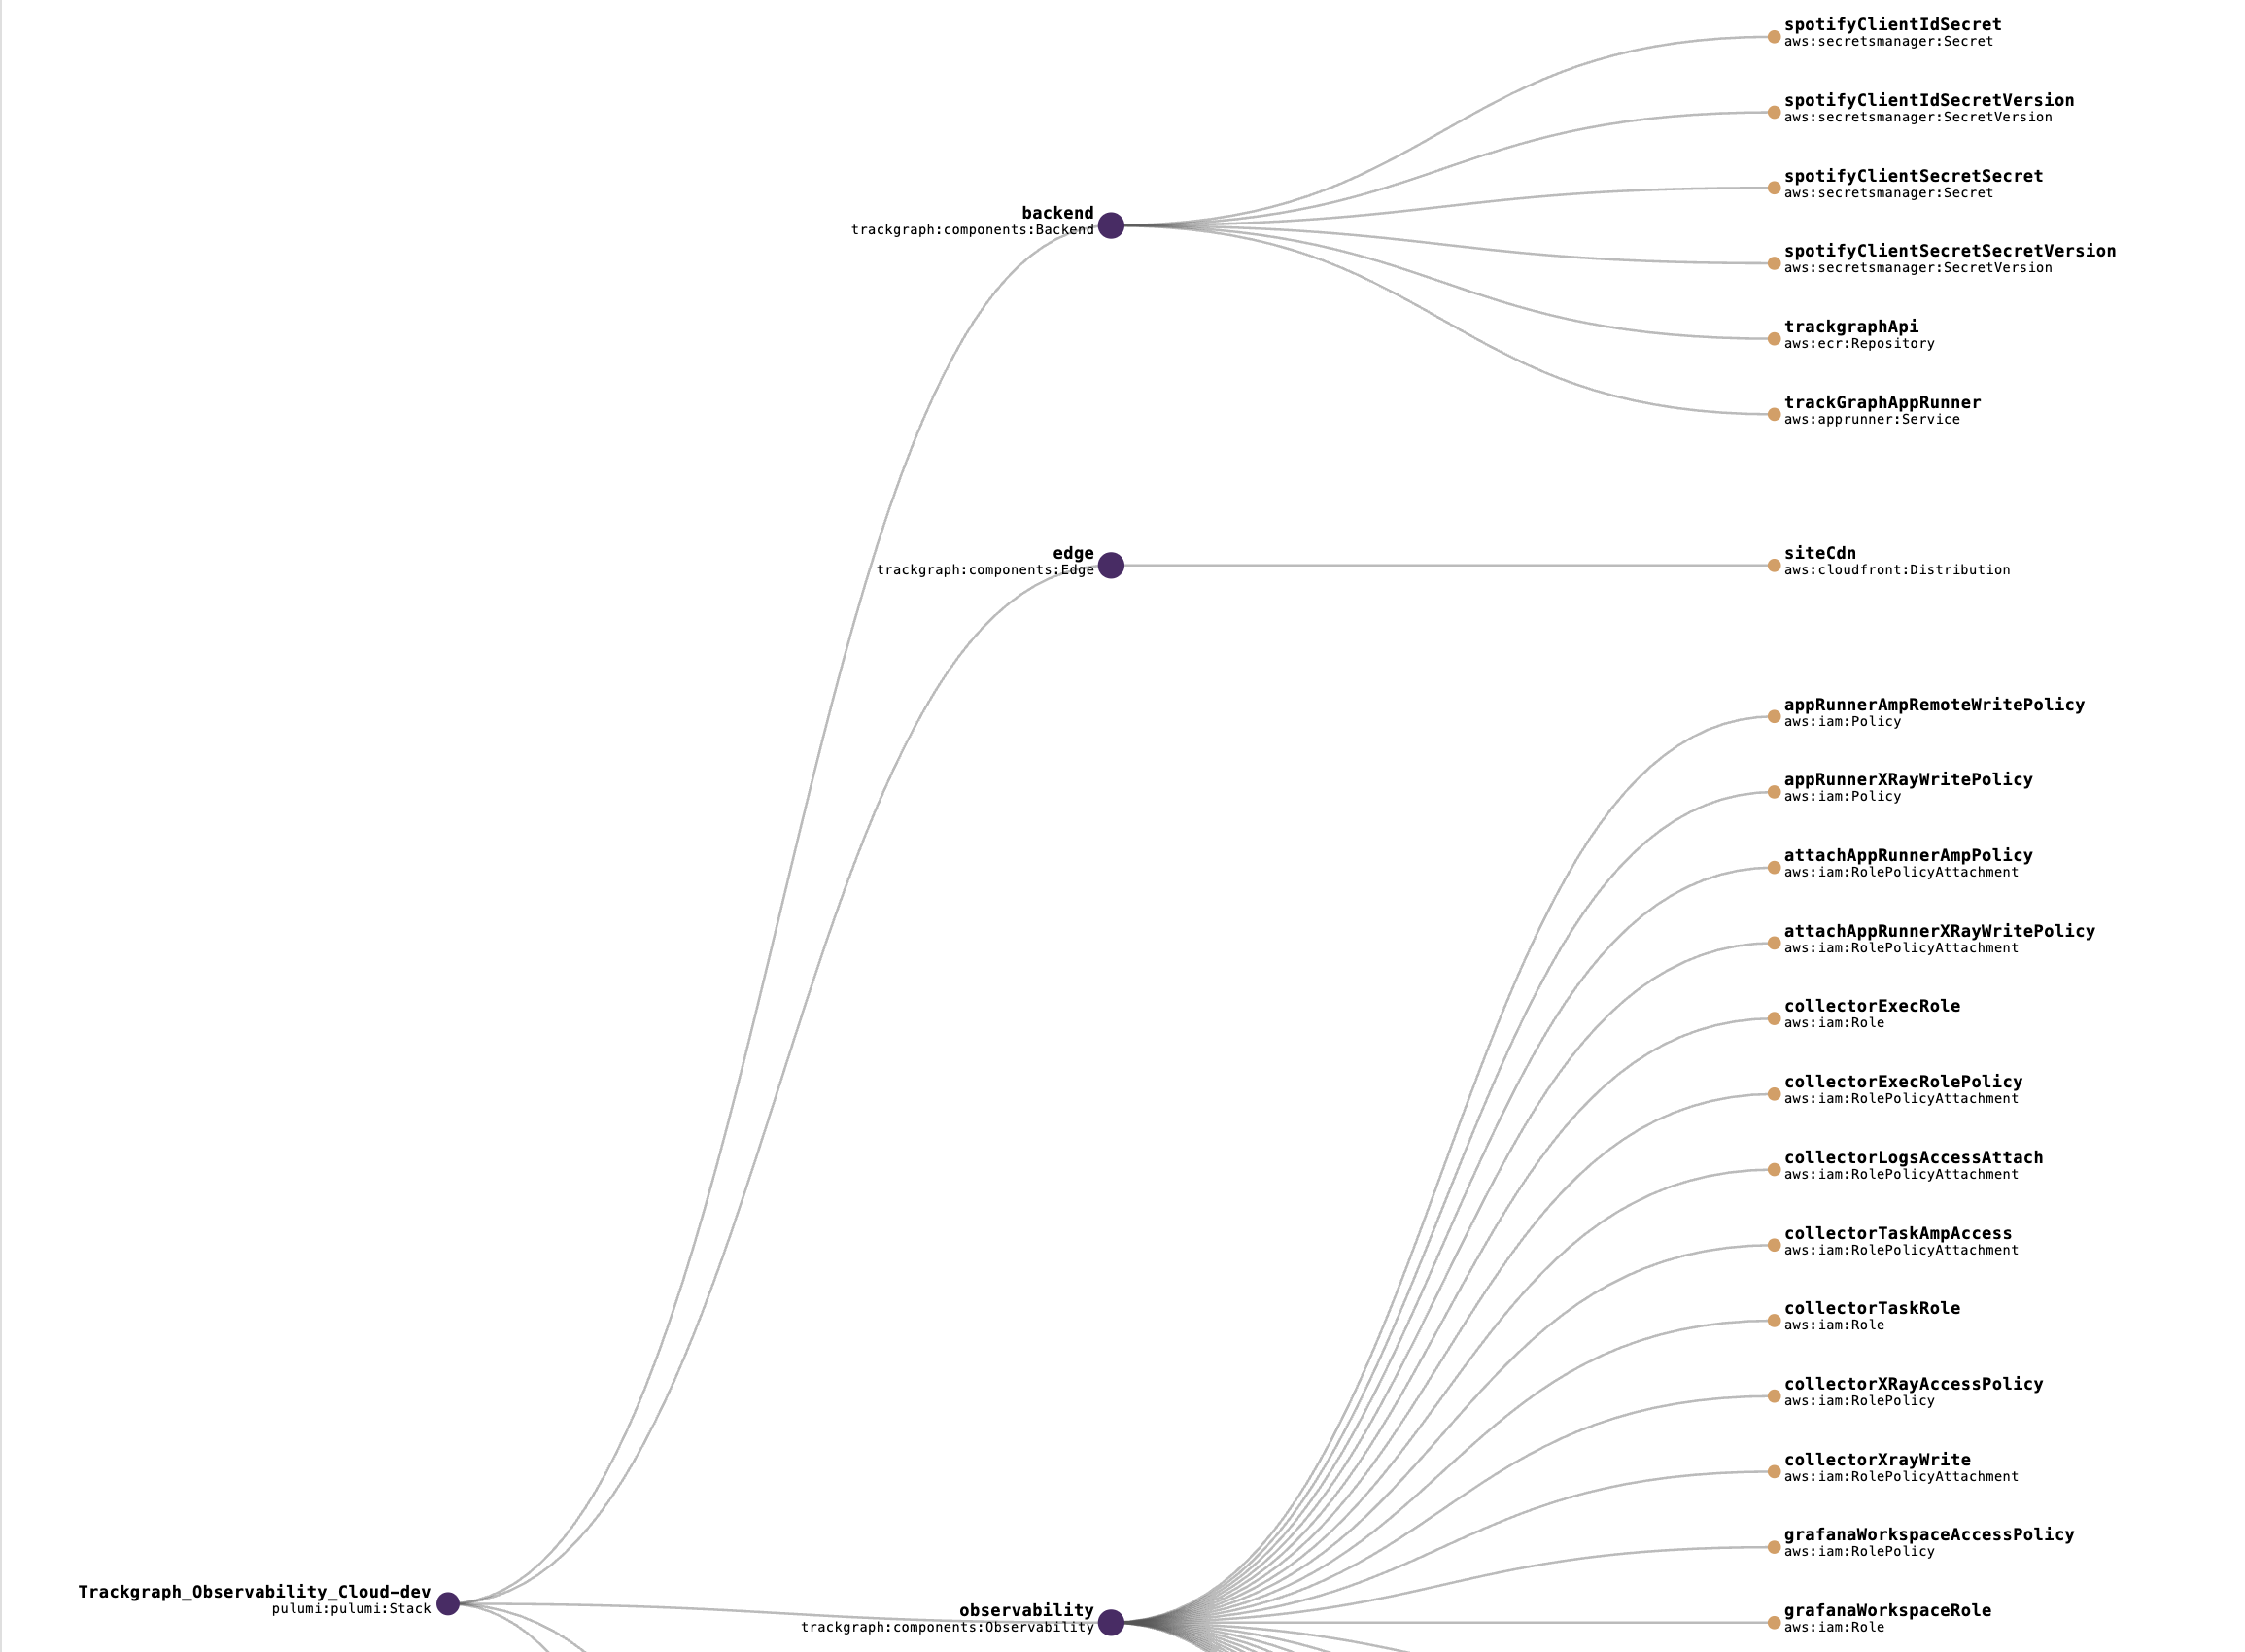
Backend Delivery: App Runner hosts the TrackGraph backend container, pulls secrets from AWS Secrets Manager, and scales on demand. OpenTelemetry auto-instrumentation ships traces directly to AWS X-Ray and the Prometheus collector plane.
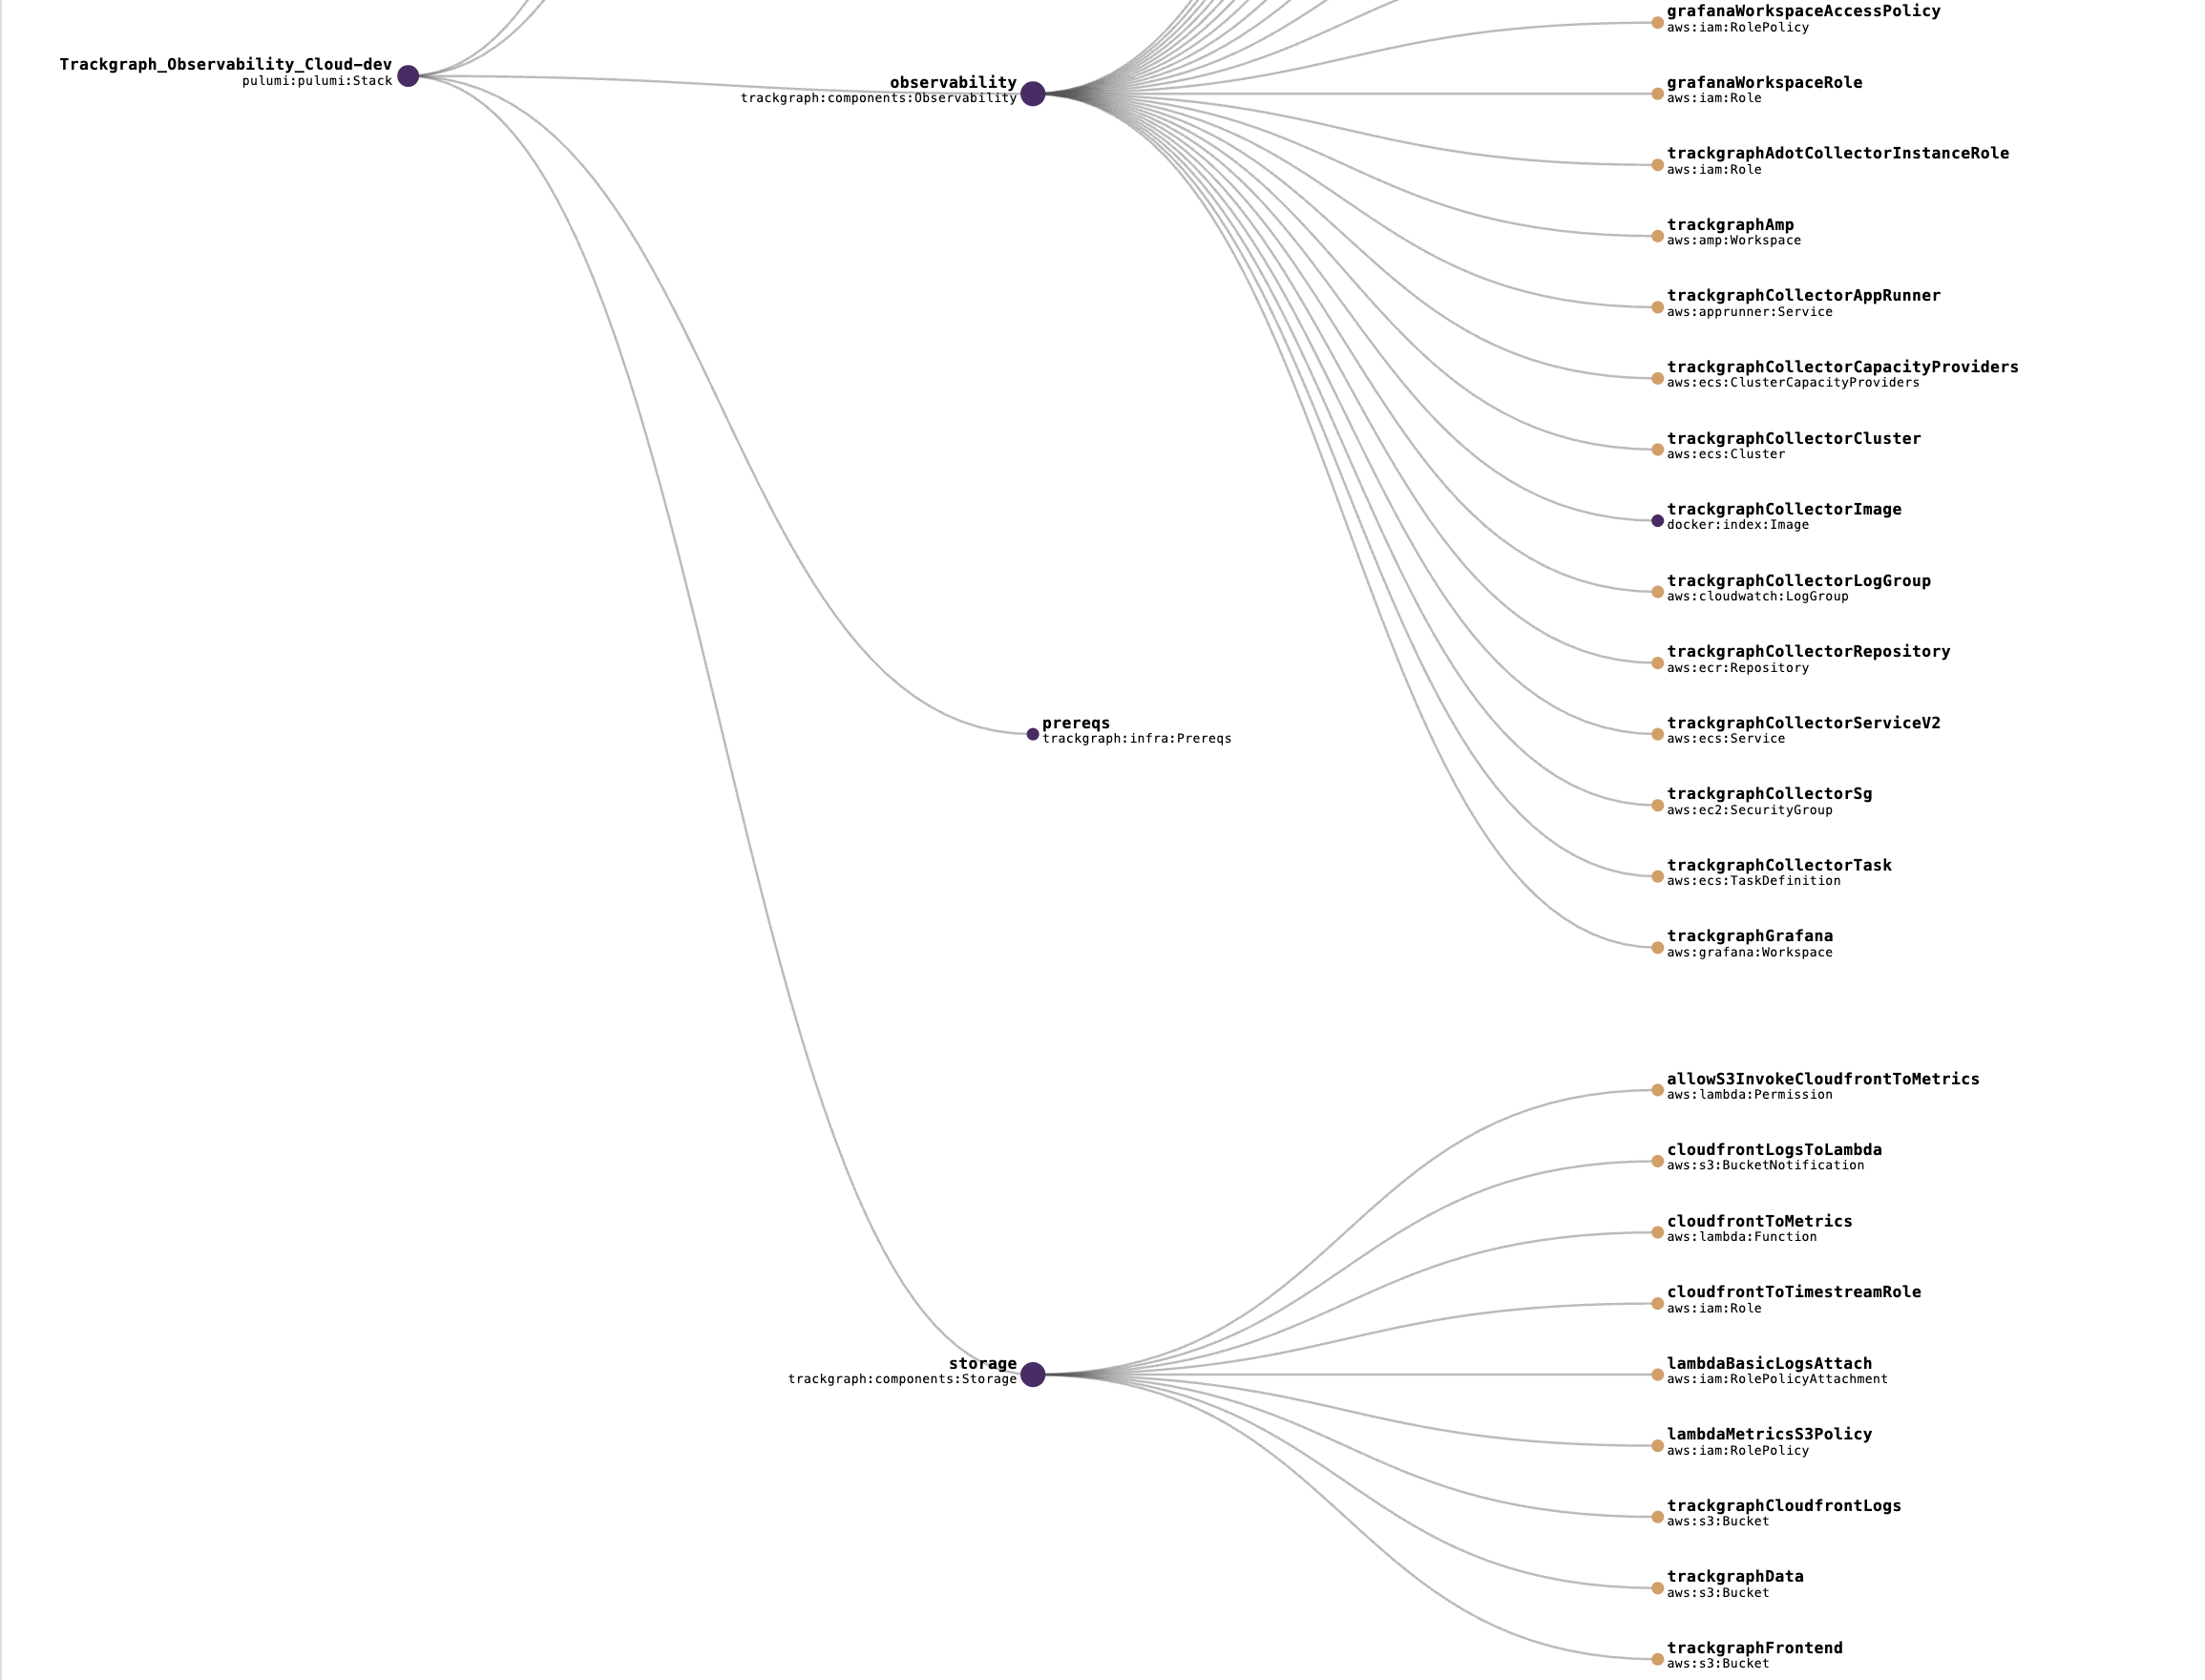
Observability Plane: An App Runner ADOT sidecar and a Fargate-based collector scrape metrics, send them to Amazon Managed Prometheus, and expose them to a managed Grafana workspace for dashboards and alerting.
Data & Edge: Three S3 buckets separate static frontend assets, CloudFront logs, and Spotify data. A CloudFront distribution fronts the static site, while a Lambda function parses access logs into CloudWatch custom metrics that feed Grafana widgets.
Repository Layout
__main__.pywires together the component modules and exports stack outputs for other services.components/contains custom PulumiComponentResourcewrappers for storage, edge, backend, and observability.infra/holds shared config helpers, optional prerequisite provisioning, and policy templates.collector-app-runner/packages the ADOT proxy and collector config for the App Runner telemetry sidecar.lambda_fn/includes the CloudFront log parser Lambda plus reusable parser and metrics libraries.tests/runs pytest coverage over the log parser and metric publisher utilities.Pulumi.yamlandPulumi.<stack>.yamldefine project metadata and per-env configuration (see the example template).
Configuration & CI
Pulumi config keys live under the trackgraph namespace, mirroring production defaults so a new stack can launch with minimal overrides.
GitHub Actions enforces formatting with Ruff, Black, and isort, runs pytest on the Lambda parser modules, and can execute a Pulumi preview
whenever AWS credentials are supplied—never a blind pulumi up from CI.
Observability Validation
- Traces confirmed in AWS X-Ray once the App Runner backend comes online.
- Prometheus remote write verified through managed Grafana dashboards.
- CloudFront log ingestion triggers the Lambda and emits metrics in the
TrackGraph/CloudFrontnamespace.
Demo
Project Details
Questions about the stack or telemetry approach? Reach out at josephsaldivarg@gmail.com.

