Project Overview
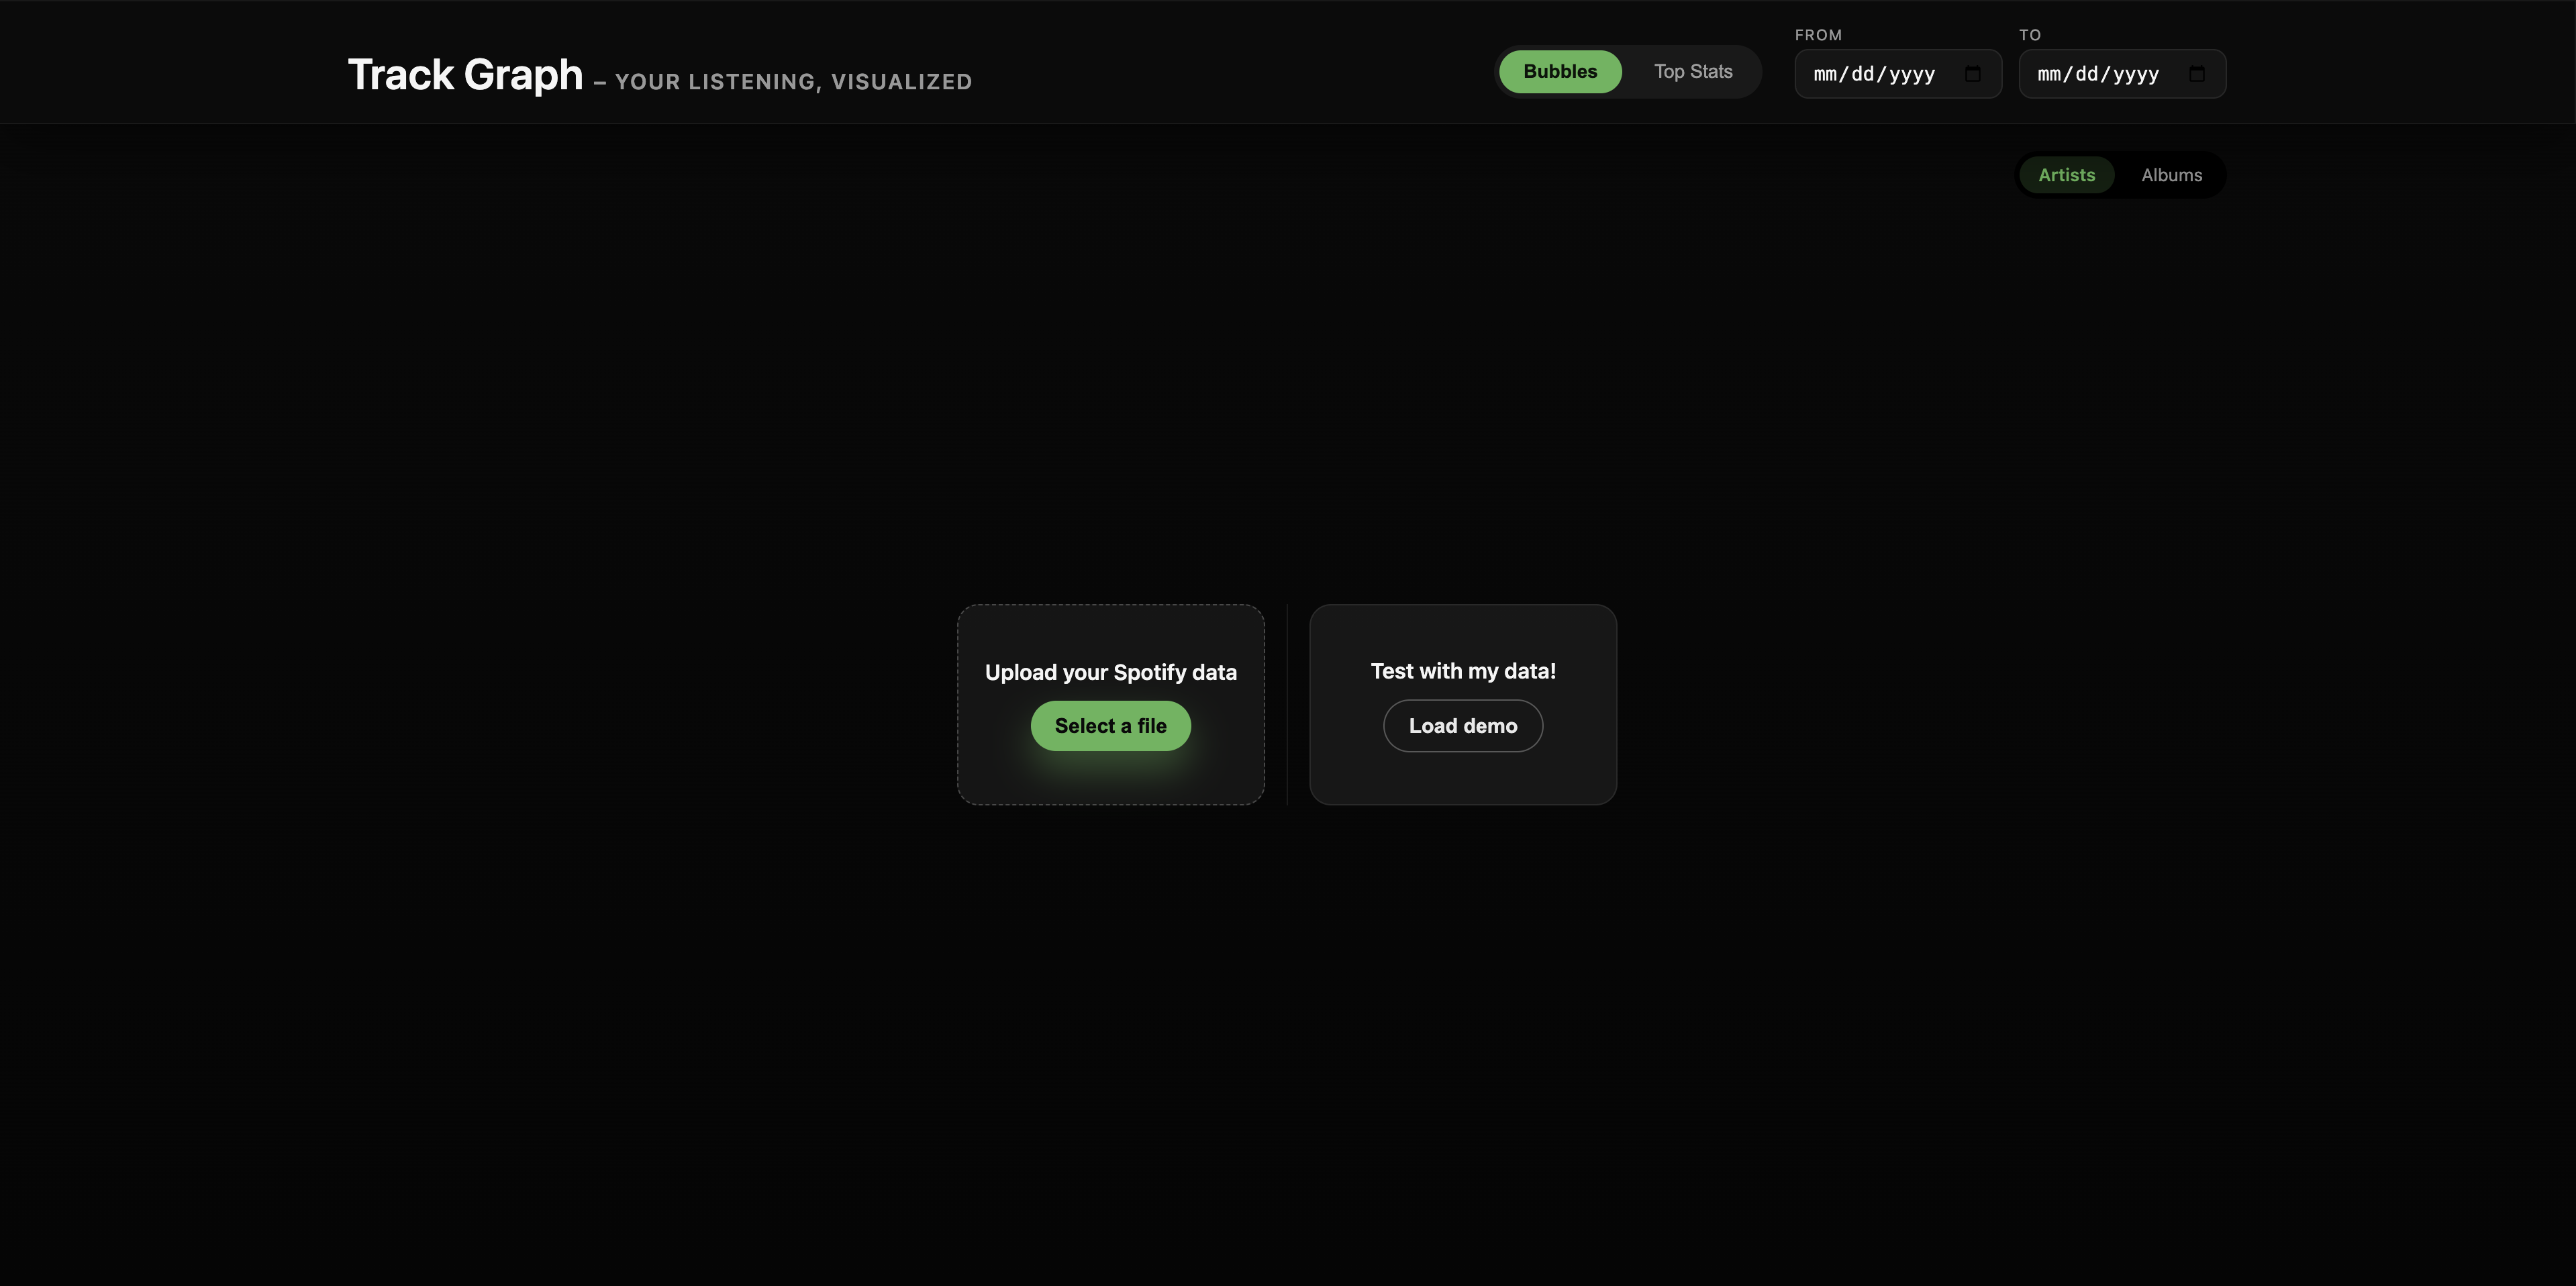
Born from a mix of data analysis curiosity and a passion for music, TrackGraph is a full‑stack web application for exploring and visualizing personal Spotify listening history. The goal was to build a smooth experience that surfaces meaningful insights about habits, preferences, and trends.
Why the Visualizer?
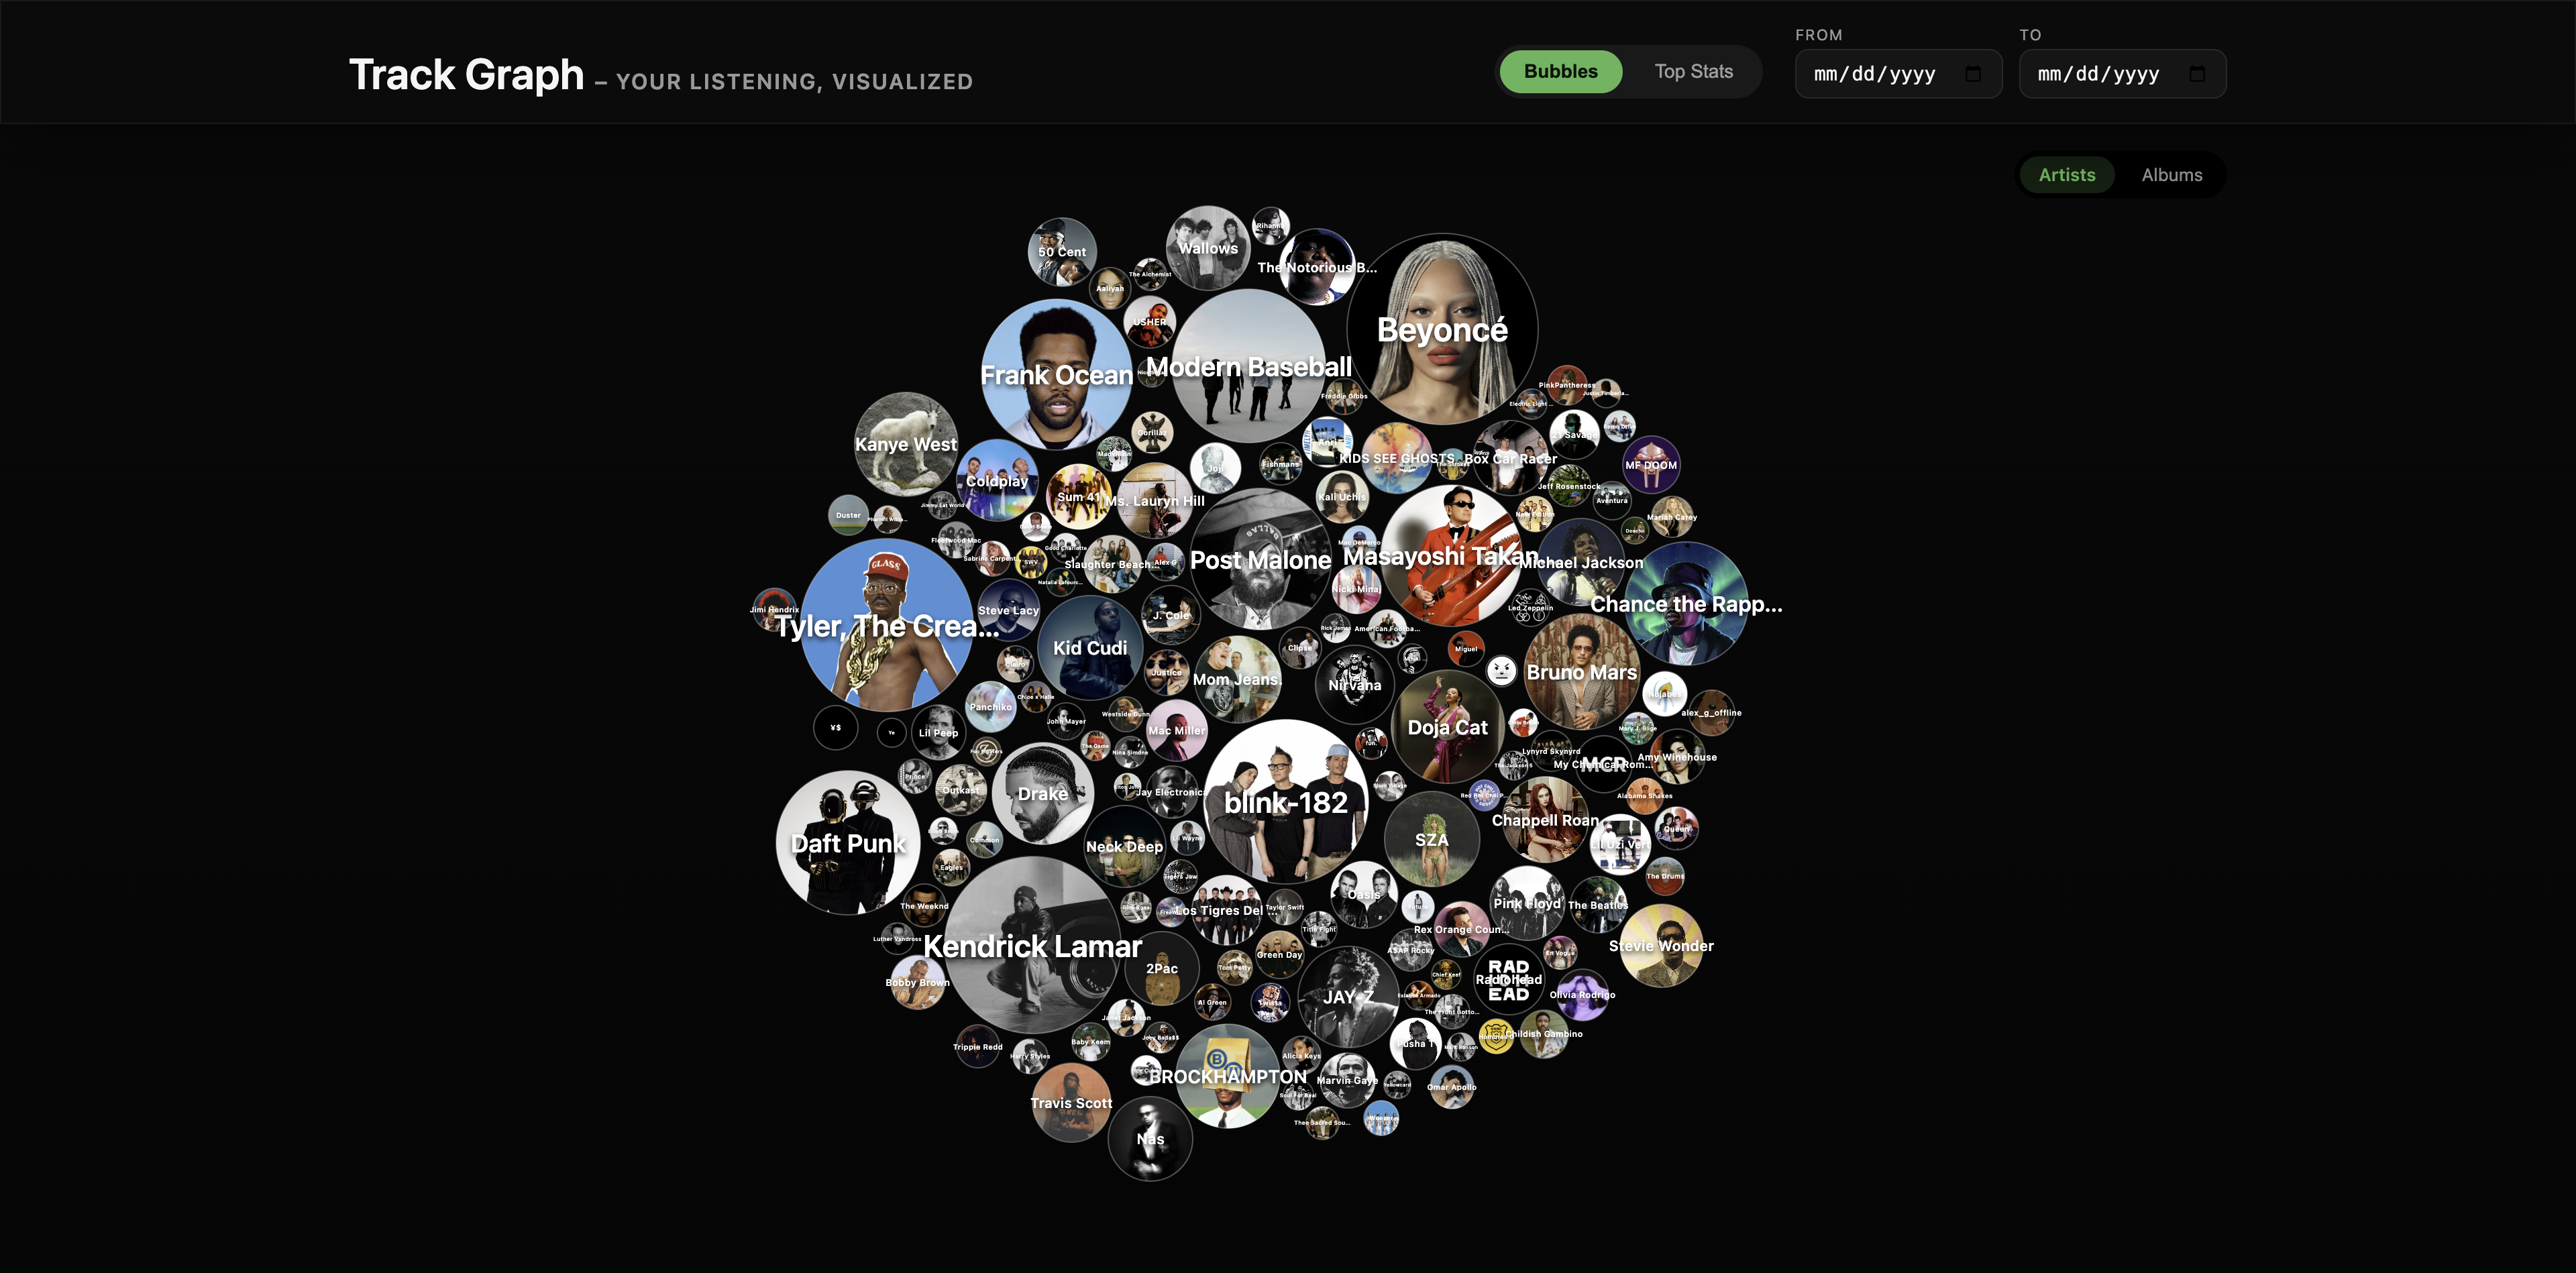
Platforms like Spotify Wrapped, Apple Music Replay, and third‑party tools (Last.fm, Stats.fm) prove user appetite for listening insights. But many experiences present similar summaries with limited interactivity. TrackGraph experiments with more expressive visuals, deeper drill‑downs, and a modern UI.
Technologies Used
- FastAPI, Python
- Pandas, NumPy
- React, D3.js
- AWS (S3)
- Git & GitHub
Key Achievements
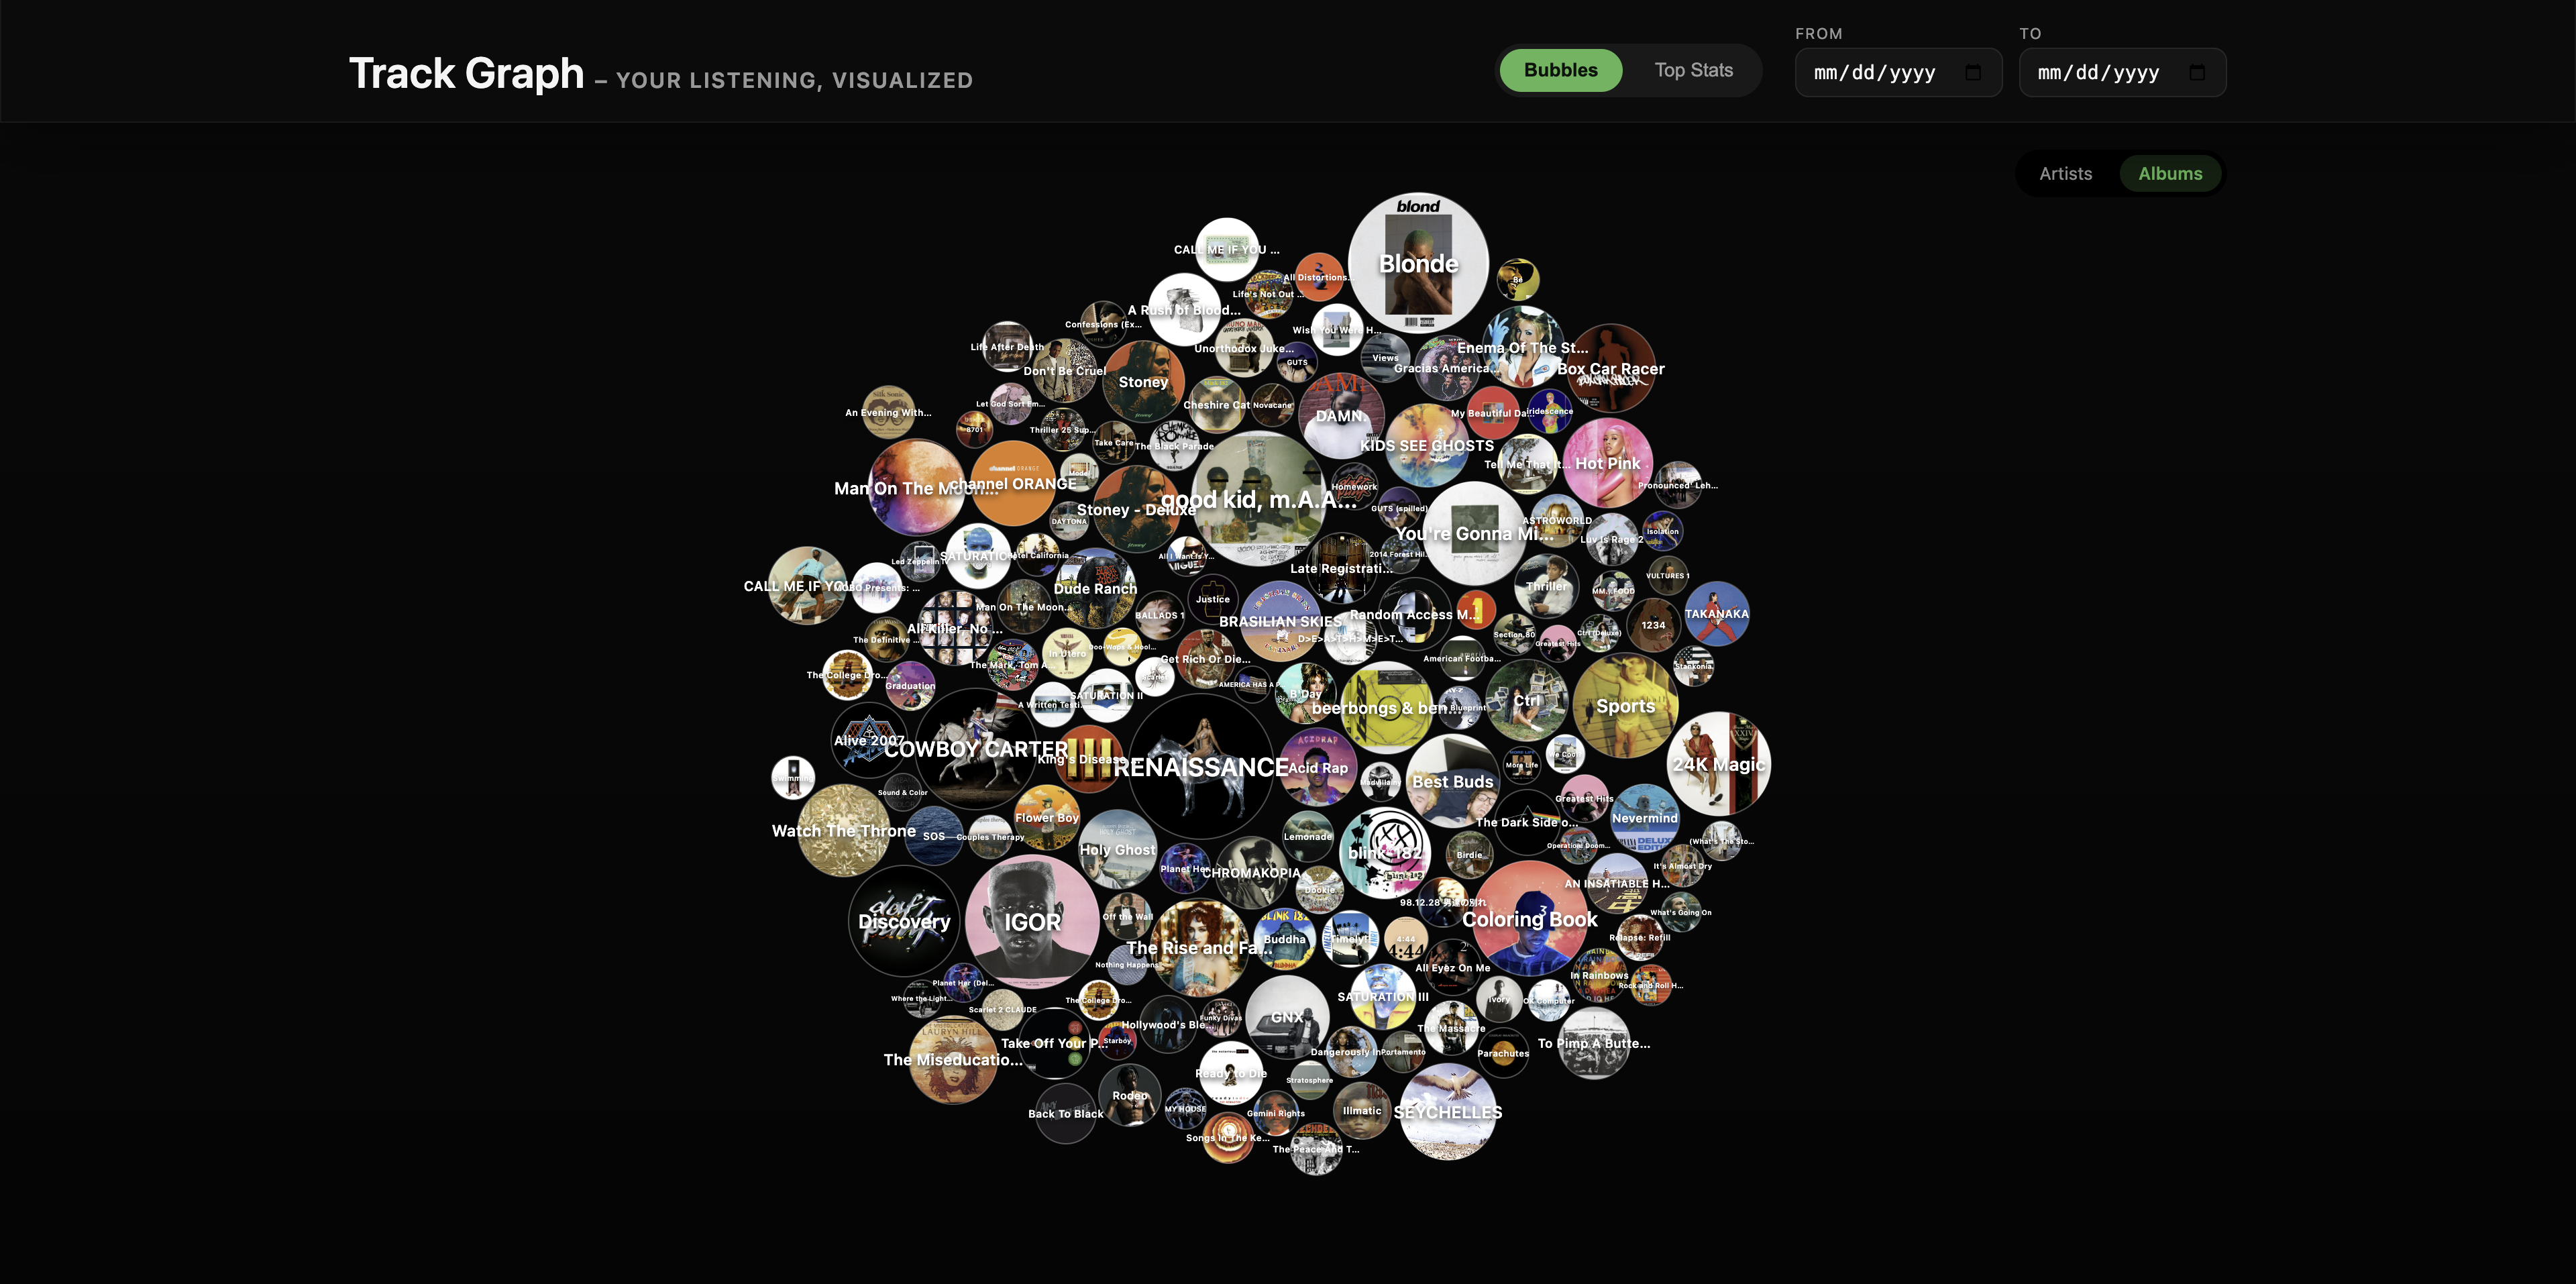
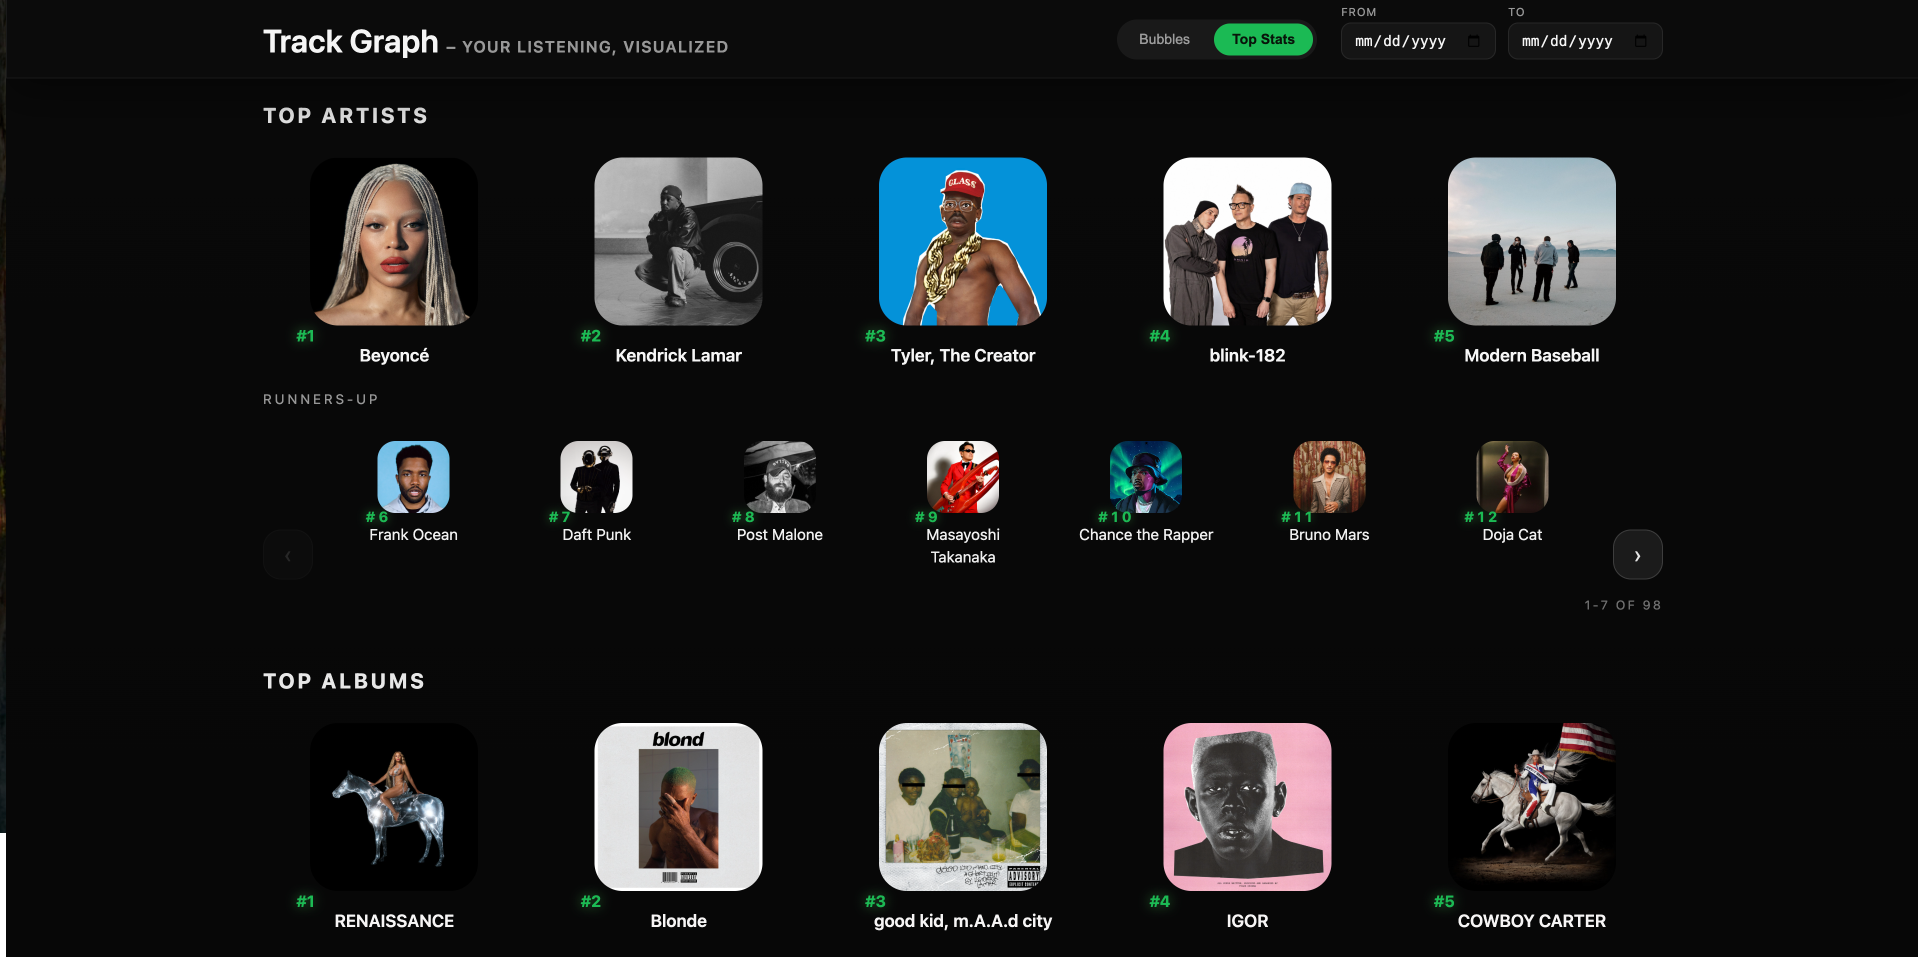
- Interactive visualizer for Spotify data
- Deployed with AWS integration
- Clean UX for exploring time‑based trends
Demo