Project Overview
Collaborated with Cal Club Field Hockey to design and implement a comprehensive database solution that revolutionized their data management approach. The system handles everything from player information and event management to merchandise tracking and predictive analytics.
Database Relation and Schema
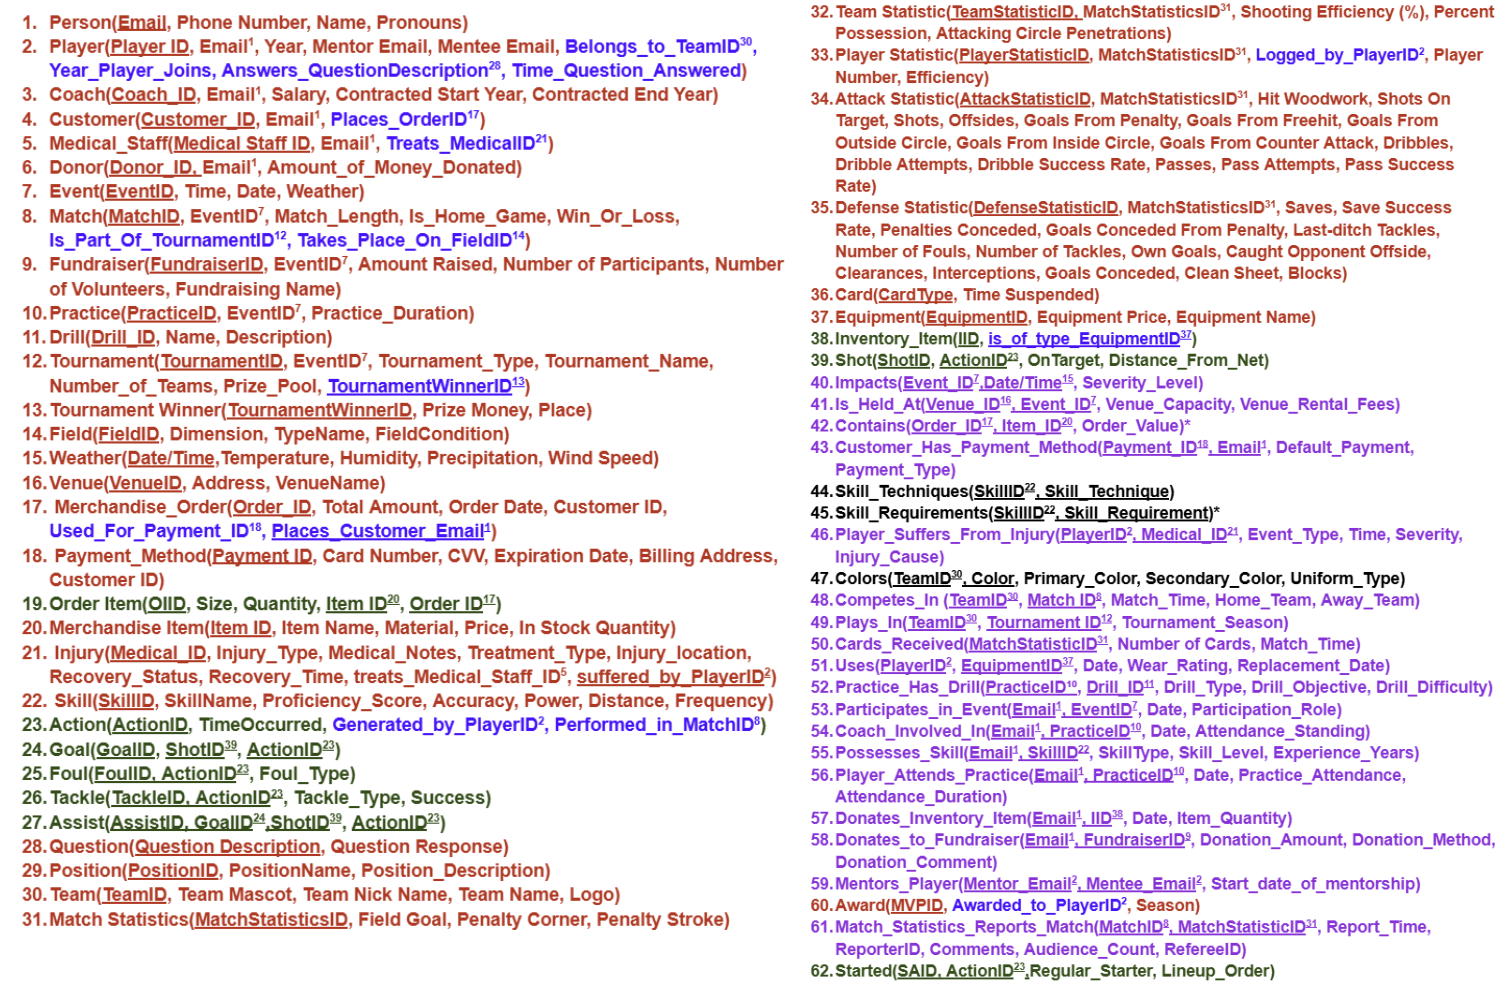
The database was designed following strict normalization principles to ensure data integrity, minimize redundancy, and optimize query performance. All the requirements for the database were kept in mind and the relations and schema were built around them.
Table Relation Design BCNF normalized
Click to Enlarge!
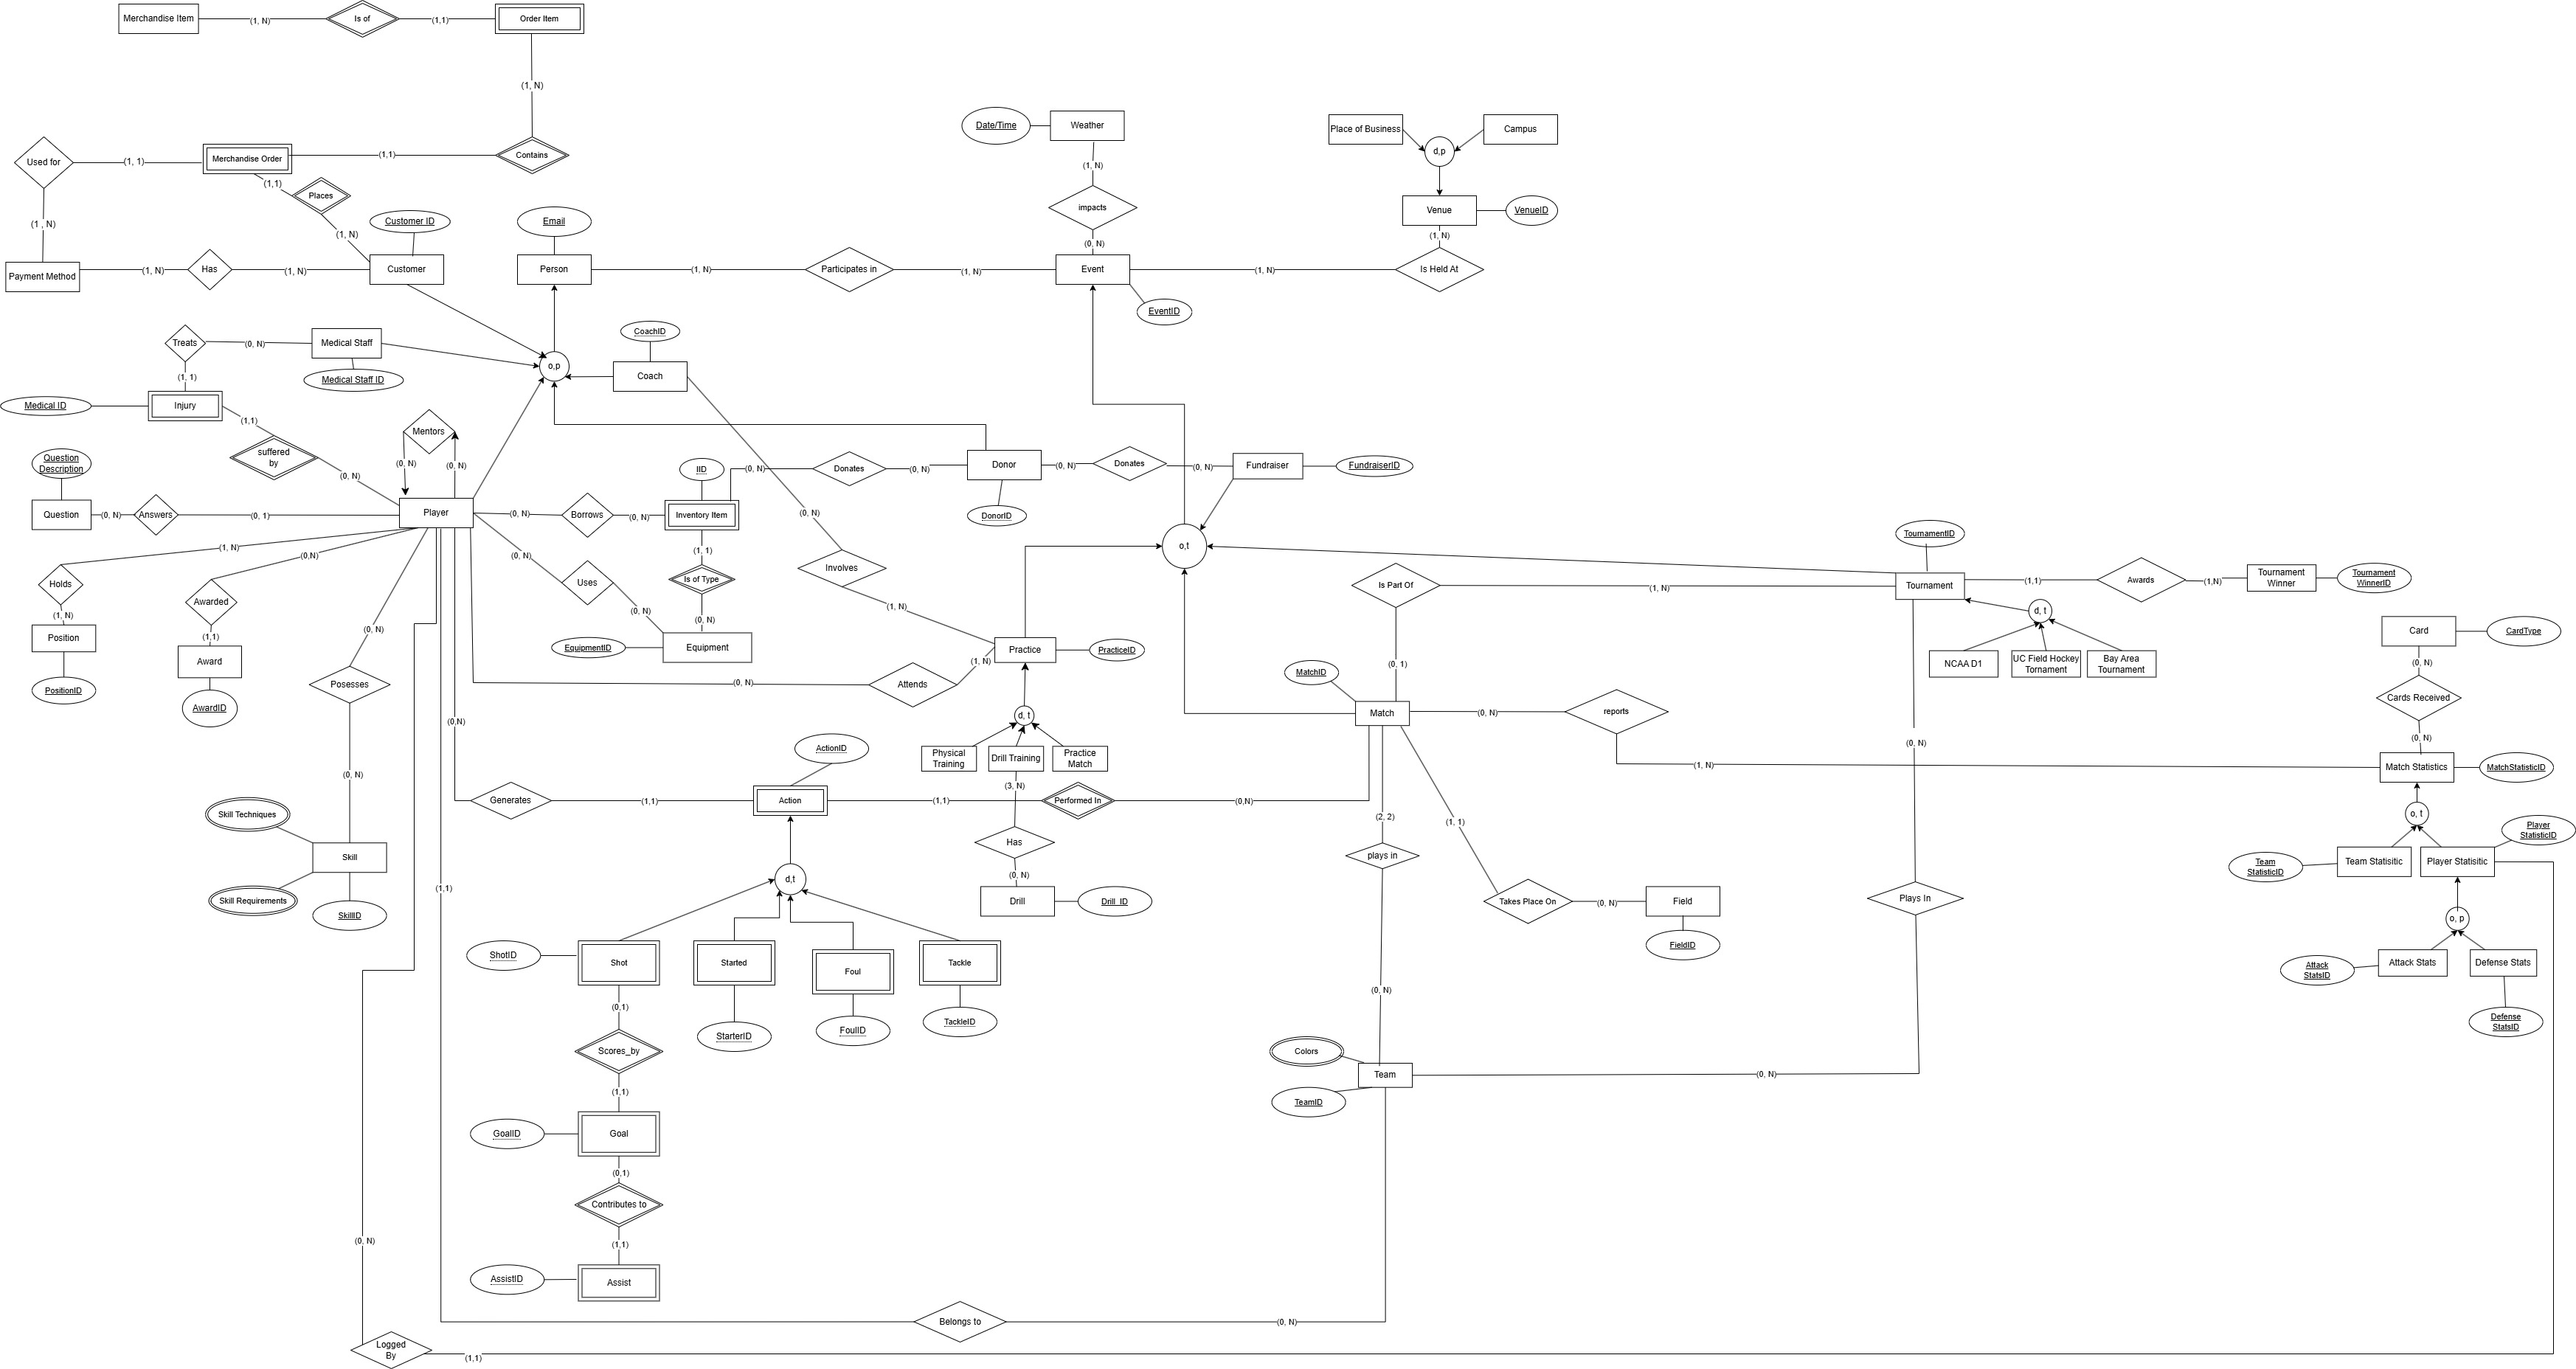
The written relations were then visualized as a simplified schema diagram to show how the tables interact with each other.
Simplified EER Diagram for Database
Click to Enlarge!
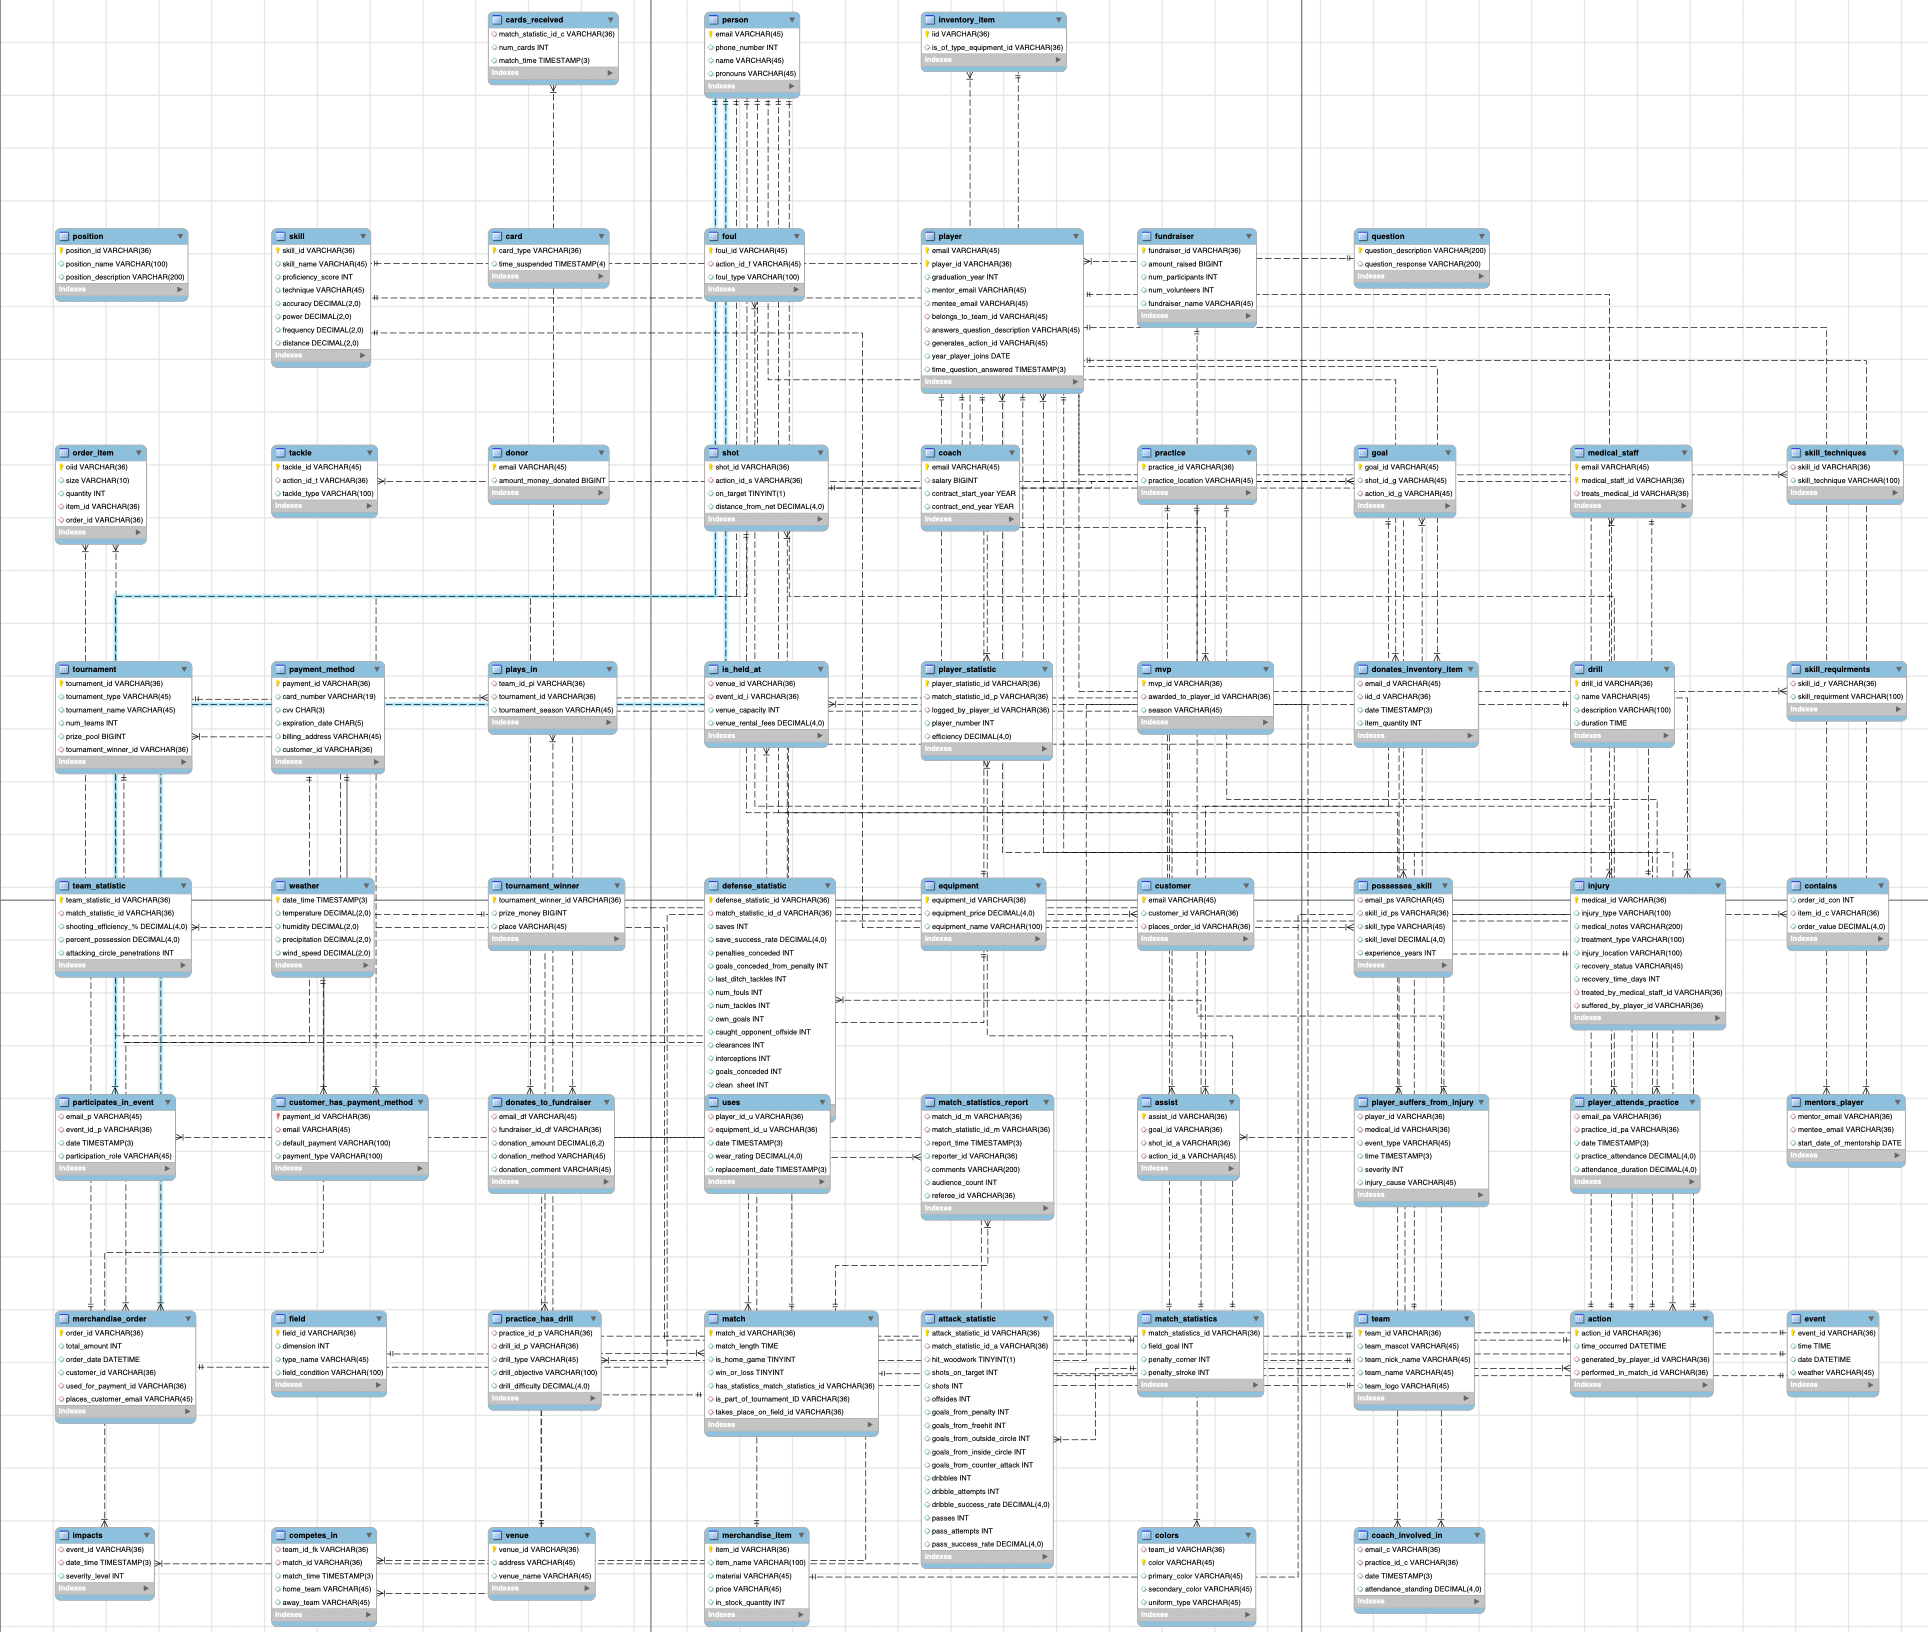
The designed database tables then implemented in MySQL Workbench.
MySQL Workbench Implementation
Click to Enlarge! (This one is better opened in a new tab)
Synthetic Data Generation
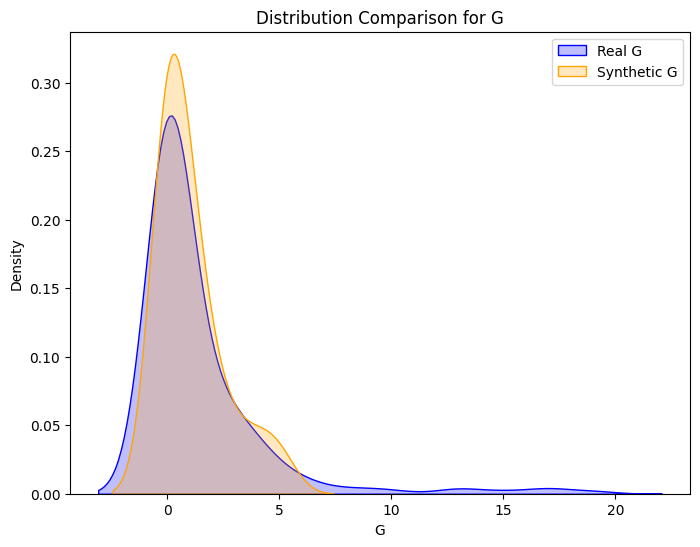
Since the database was to be presented the client along with an audience, it was important to hide any sensitive information. Even so the database needed to be populated with realistic data to demonstrate its functionality. To achieve this, I developed a Python script that generated synthetic data for the player performance tables based on real-world historical data. This approach ensured that the database was both secure and functional for demonstration purposes. There were also several logic constrainsts that needed to be applied to the data to ensure realism, for example, there shouldn't be more goals scored for a player than the amount of shots they took.
# %%
import pandas as pd
import numpy as np
# %%
df = pd.read_csv('field_hockey_stats_fixed1.csv', header=0)
df
# %%
import pandas as pd
import numpy as np
from copulas.multivariate import GaussianMultivariate
from copulas.univariate import GaussianKDE
# Load real-world data
real_data = df[["G","GS", "A", "SH", "SOG", "SH%", "SOG%"]].dropna()
# Define copula model
model = GaussianMultivariate(distribution={ # Use GaussianKDE for all variables
"G": GaussianKDE(),
"GS": GaussianKDE(),
"A": GaussianKDE(),
"SH": GaussianKDE(),
"SOG": GaussianKDE(),
"SH%": GaussianKDE(),
"SOG%": GaussianKDE(),
})
# Fit the copula to real data
model.fit(real_data)
# Generate synthetic data
num_samples = 20 # Adjusted to reflect a single season's worth of data
num_matches = 20 # Assuming 20 games in a season
total_starts = 11 * num_matches
synthetic_data = model.sample(num_samples)
# Convert to DataFrame
synthetic_df = pd.DataFrame(synthetic_data, columns=["G","GS", "A", "SH", "SOG", "SH%", "SOG%"])
# Ensure logical constraints
synthetic_df["G"] = synthetic_df["G"].clip(lower=0).round() # Goals: Non-negative, rounded
synthetic_df["A"] = synthetic_df["A"].clip(lower=0).round() # Assists: Non-negative, rounded
synthetic_df["SH"] = synthetic_df["SH"].clip(lower=0).round() # Shots: Non-negative, rounded
synthetic_df["SOG"] = synthetic_df["SOG"].clip(lower=0).round() # SOG: Non-negative, rounded
synthetic_df["SOG"] = synthetic_df[["SOG", "SH"]].min(axis=1) # SOG ≤ SH
synthetic_df["G"] = synthetic_df[["G", "SH"]].min(axis=1) # G ≤ SH
# Adjust GS to follow the 11 starters per match constraint
synthetic_df["GS"] = synthetic_df["GS"].clip(lower=0).round() # Clip negative values
synthetic_df["GS"] = synthetic_df["GS"].apply(lambda x: min(x, num_matches)) # GS ≤ matches
# Scale GS to ensure total GS = 11 * num_matches
gs_scaling_factor = total_starts / synthetic_df["GS"].sum()
synthetic_df["GS"] = (synthetic_df["GS"] * gs_scaling_factor).round()
# Redistribute excess starts
while synthetic_df["GS"].max() > num_matches:
# Find players with excess starts
excess_players = synthetic_df[synthetic_df["GS"] > num_matches]
deficit_players = synthetic_df[synthetic_df["GS"] < num_matches]
for idx, row in excess_players.iterrows():
excess = row["GS"] - num_matches
synthetic_df.loc[idx, "GS"] = num_matches # Cap GS at max matches
# Redistribute excess starts to players with deficits
for deficit_idx, deficit_row in deficit_players.iterrows():
if excess <= 0:
break
needed = num_matches - deficit_row["GS"]
redistribute = min(excess, needed)
synthetic_df.loc[deficit_idx, "GS"] += redistribute
excess -= redistribute
# Enforce Goals ≥ Assists
synthetic_df["A"] = synthetic_df[["A", "G"]].min(axis=1) # Assists ≤ Goals
# Calculate derived percentages
synthetic_df["SH%"] = (synthetic_df["G"] / np.maximum(synthetic_df["SH"], 1)).clip(0, 1) # SH% = Goals / Shots
synthetic_df["SOG%"] = (synthetic_df["SOG"] / np.maximum(synthetic_df["SH"], 1)).clip(0, 1) # SOG% = SOG / Shots
# Save and validate
synthetic_df.to_csv("refined_simulated_data.csv", index=False)
print("Simulated Data Correlation:\n", synthetic_df.corr())
real_corr = df[["G","GS","A", "SH", "SOG", "SH%", "SOG%"]].corr()
print("\nReal Data Correlation:\n", real_corr)
# %%
print(synthetic_df)
# %%
#print sum of GS column
print(synthetic_df['GS'].sum())
# %%
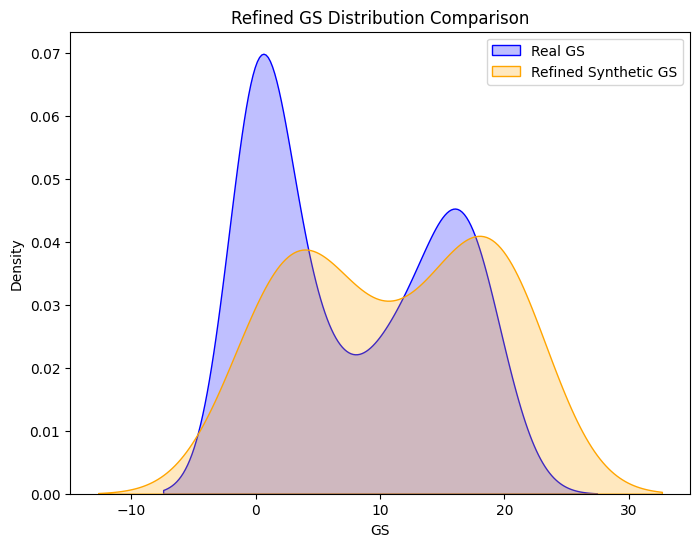
from scipy.stats import gaussian_kde
# Plot the refined GS distribution
plt.figure(figsize=(8, 6))
sns.kdeplot(real_data["GS"], label="Real GS", shade=True, color="blue")
sns.kdeplot(synthetic_df["GS"], label="Refined Synthetic GS", shade=True, color="orange")
plt.title("Refined GS Distribution Comparison")
plt.xlabel("GS")
plt.ylabel("Density")
plt.legend()
plt.show()
# Validate using Kolmogorov-Smirnov test
ks_stat, p_value = ks_2samp(real_data["GS"], synthetic_df["GS"])
print(f"Refined GS - KS Statistic: {ks_stat:.4f}, P-Value: {p_value:.4f}")
# %%
import matplotlib.pyplot as plt
import seaborn as sns
from scipy.stats import ks_2samp
# List of all stats to compare
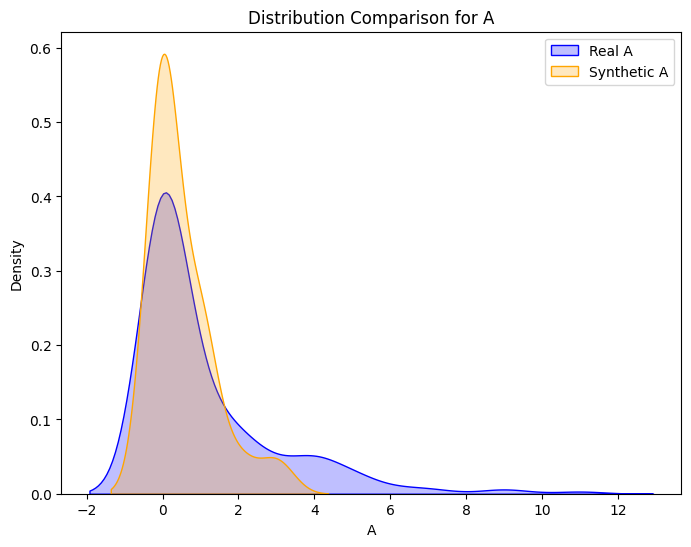
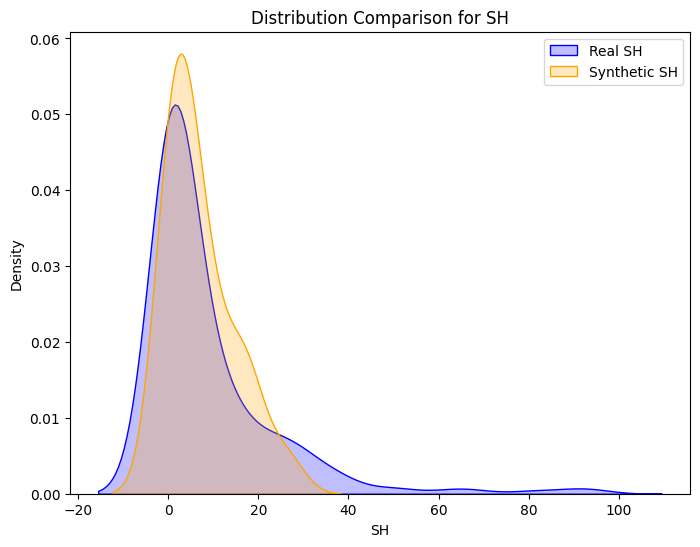
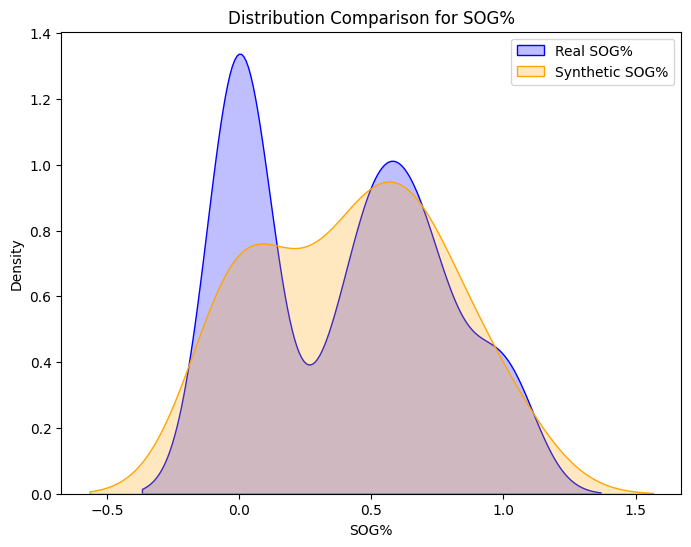
columns_to_validate = ["G", "GS", "A", "SH", "SOG", "SH%", "SOG%"]
# Validate distributions for each column
for col in columns_to_validate:
plt.figure(figsize=(8, 6))
sns.kdeplot(real_data[col], label=f"Real {col}", shade=True, color='blue')
sns.kdeplot(synthetic_df[col], label=f"Synthetic {col}", shade=True, color='orange')
plt.title(f"Distribution Comparison for {col}")
plt.xlabel(col)
plt.ylabel("Density")
plt.legend()
plt.show()
# Kolmogorov-Smirnov test
ks_stat, p_value = ks_2samp(real_data[col], synthetic_df[col])
print(f"{col} - KS Statistic: {ks_stat:.4f}, P-Value: {p_value:.4f}")
# %%
#get games started by player
#starter_df = pd.read_csv("starter.csv")
# Get the number of games started by each player
starter_count = starter_df["PlayerID"].value_counts()
print((starter_count))
# %%
synthetic_df.to_csv("refined_simulated_data.csv", index=False)
from faker import Faker
# %%
synthetic_df = pd.read_csv("refined_simulated_data.csv")
print(sum(synthetic_df['GS']))
# %%
import pandas as pd
import numpy as np
from faker import Faker
fake = Faker()
Faker.seed(2)
#players and matches in a season
num_players = 20
num_matches = 20
#make player data
person_data = pd.DataFrame({
"Name": [fake.name() for _ in range(num_players)],
"Phone Number": [fake.phone_number() for _ in range(num_players)],
"Email": [fake.email() for _ in range(num_players)],
"Pronouns": np.random.choice(["They/Them", "She/Her"], size=num_players),
})
#make playerids
person_data['PlayerID'] = [f"P{i}" for i in range(num_players)]
#add year and team
player_data = pd.DataFrame({
"PlayerID": person_data["PlayerID"],
"Email": person_data["Email"],
"Year": np.random.choice([2024], size=num_players),
"Belongs_to_TeamID": np.random.choice(["T1"], size=num_players)
})
# === Load and Prepare Synthetic Data === #
# Assuming synthetic_df is already loaded or generated
synthetic_df["PlayerID"] = person_data["PlayerID"] # Link synthetic data to players
# Generate starters per match
gs_list = synthetic_df["GS"].astype(int).tolist()
starters_per_match = distribute_starts_exact_fixed(gs_list, num_players, num_matches)
action_list = []
goal_list = []
shot_list = []
assist_list = []
starter_list = []
goal_counter = 1
shot_counter = 1
assist_counter = 1
# Generate starter table from starters_per_match
for match_idx, starters in enumerate(starters_per_match):
match_id = f"M{match_idx+1}"
for player_idx in starters:
player_id = f"P{player_idx}"
action_id = f"A{len(starter_list)}" # Unique action ID for each starter
starter_list.append({
"StarterActionID": action_id,
"PlayerID": player_id,
"MatchID": match_id
})
for idx, row in synthetic_df.iterrows():
player_id = row["PlayerID"]
num_goals = int(row["G"])
num_shots = int(row["SH"])
num_assists = int(row["A"])
# Skip processing if assists > goals (invalid case)
if num_assists > num_goals:
print(f"PlayerID {player_id}: Skipping assists split as total assists > goals.")
num_assists = num_goals
# Distribute goals and assists together
goals_per_match, assists_per_match = distribute_goals_and_assists(num_goals, num_assists, num_matches)
shots_per_match = np.random.multinomial(num_shots, [1/num_matches] * num_matches)
for match_idx in range(num_matches):
match_id = f"M{match_idx+1}"
# Create actions for shots
for _ in range(shots_per_match[match_idx]):
action_id = f"A{len(action_list)}"
shot_id = f"S{shot_counter:02d}"
shot_counter += 1
action_list.append({
"ActionID": action_id,
"Generated_by_PlayerID": player_id,
"Performed_in_MatchID": match_id
})
shot_list.append({
"ShotID": shot_id,
"ActionID": action_id,
"Generated_by_PlayerID": player_id,
"Performed_in_MatchID": match_id
})
# Create actions for goals
for _ in range(goals_per_match[match_idx]):
if shot_list:
shot_id = shot_list[-1]["ShotID"] # Use the latest shot as reference
else:
shot_id = None
action_id = f"A{len(action_list)}"
goal_id = f"G{goal_counter:02d}"
goal_counter += 1
action_list.append({
"ActionID": action_id,
"Generated_by_PlayerID": player_id,
"Performed_in_MatchID": match_id
})
goal_list.append({
"GoalID": goal_id,
"ActionID": action_id,
"ShotID": shot_id,
"Generated_by_PlayerID": player_id,
"Performed_in_MatchID": match_id
})
# Create actions for assists
for _ in range(assists_per_match[match_idx]):
goal_id = goal_list[-1]["GoalID"] # Match assist to the latest goal
action_id = f"A{len(action_list)}"
assist_id = f"A{assist_counter}"
assist_counter += 1
action_list.append({
"ActionID": action_id,
"Generated_by_PlayerID": player_id,
"Performed_in_MatchID": match_id
})
assist_list.append({
"AssistID": assist_id,
"ActionID": action_id,
"GoalID": goal_id,
"Generated_by_PlayerID": player_id,
"Performed_in_MatchID": match_id
})
# Convert to DataFrames
actions_df = pd.DataFrame(action_list)
goals_df = pd.DataFrame(goal_list)
shots_df = pd.DataFrame(shot_list)
assists_df = pd.DataFrame(assist_list)
starter_df = pd.DataFrame(starter_list)
# Display generated tables
print("\nPerson Table:")
print(person_data.head())
print("\nPlayer Table:")
print(player_data.head())
print("\nSynthetic Stats Table:")
print(synthetic_df.head())
print("\nActions Table:")
print(actions_df.head())
print("\nGoals Table:")
print(goals_df.head())
print("\nShots Table:")
print(shots_df.head())
print("\nAssists Table:")
print(assists_df.head())
print("\nStarter Actions Table:")
print(starter_df.head())
# %%
#print the amount of starts per player
print(sum(starter_df['PlayerID'].value_counts()))
# %%
#print the amount of sterter actions per matchID
print(starter_df['MatchID'].value_counts())
print(sum(synthetic_df['GS']))
# %%
# Validation Functions
def validate_match_consistency(actions_df, goals_df, assists_df):
"""Checks if assists reference goals from the same match."""
errors = []
for _, assist in assists_df.iterrows():
goal_match = goals_df.loc[goals_df["GoalID"] == assist["GoalID"], "Performed_in_MatchID"]
if not goal_match.empty and goal_match.iloc[0] != assist["Performed_in_MatchID"]:
errors.append(f"AssistID {assist['AssistID']} references GoalID {assist['GoalID']} from a different match.")
return errors
def validate_season_totals(synthetic_df, goals_df, assists_df, shots_df):
"""Validates that the sum of match stats equals the original seasonal stats."""
player_ids = synthetic_df["PlayerID"].unique()
errors = []
for player_id in player_ids:
# Fetch totals from synthetic_df
total_goals = synthetic_df.loc[synthetic_df["PlayerID"] == player_id, "G"].sum()
total_assists = synthetic_df.loc[synthetic_df["PlayerID"] == player_id, "A"].sum()
total_shots = synthetic_df.loc[synthetic_df["PlayerID"] == player_id, "SH"].sum()
# Fetch totals from match-level data
match_goals = goals_df.loc[goals_df["Generated_by_PlayerID"] == player_id].shape[0]
match_assists = assists_df.loc[assists_df["Generated_by_PlayerID"] == player_id].shape[0]
match_shots = shots_df.loc[shots_df["Generated_by_PlayerID"] == player_id].shape[0]
# Compare totals
if total_goals != match_goals:
errors.append(f"PlayerID {player_id}: Total goals mismatch (Season: {total_goals}, Matches: {match_goals}).")
if total_assists != match_assists:
errors.append(f"PlayerID {player_id}: Total assists mismatch (Season: {total_assists}, Matches: {match_assists}).")
if total_shots != match_shots:
errors.append(f"PlayerID {player_id}: Total shots mismatch (Season: {total_shots}, Matches: {match_shots}).")
return errors
def validate_references(goals_df, assists_df, shots_df):
"""Ensures references in tables are valid."""
errors = []
# Validate that all GoalIDs in Assists exist in Goals
invalid_goal_refs = assists_df.loc[~assists_df["GoalID"].isin(goals_df["GoalID"])]
for _, assist in invalid_goal_refs.iterrows():
errors.append(f"AssistID {assist['AssistID']} references invalid GoalID {assist['GoalID']}.")
# Validate that all ShotIDs in Goals exist in Shots
invalid_shot_refs = goals_df.loc[~goals_df["ShotID"].isin(shots_df["ShotID"])]
for _, goal in invalid_shot_refs.iterrows():
errors.append(f"GoalID {goal['GoalID']} references invalid ShotID {goal['ShotID']}.")
return errors
def validate_starters_per_match(starter_df, num_matches):
"""Validates that no match has more than 11 starters and that total starts equals 11 * num_matches."""
errors = []
total_starters = 0
for match_idx in range(1, num_matches + 1):
match_id = f"M{match_idx}"
starters_in_match = starter_df.loc[starter_df["MatchID"] == match_id].shape[0]
total_starters += starters_in_match
if starters_in_match > 11:
errors.append(f"MatchID {match_id} exceeds 11 starters ({starters_in_match} starters).")
# Validate total starts
expected_starters = 11 * num_matches
if total_starters != expected_starters:
errors.append(f"Total starters mismatch (Expected: {expected_starters}, Found: {total_starters}).")
return errors
# Run Validations
print("Validating match-level consistency...")
match_consistency_errors = validate_match_consistency(actions_df, goals_df, assists_df)
if match_consistency_errors:
print("Match consistency errors found:")
for error in match_consistency_errors:
print(error)
else:
print("Match consistency validation passed.")
print("\nValidating seasonal totals...")
season_totals_errors = validate_season_totals(synthetic_df, goals_df, assists_df, shots_df)
if season_totals_errors:
print("Season totals validation errors found:")
for error in season_totals_errors:
print(error)
else:
print("Season totals validation passed.")
print("\nValidating references...")
reference_errors = validate_references(goals_df, assists_df, shots_df)
if reference_errors:
print("Reference validation errors found:")
for error in reference_errors:
print(error)
else:
print("Reference validation passed.")
print("\nValidating starters per match...")
starter_validation_errors = validate_starters_per_match(starter_df, num_matches)
if starter_validation_errors:
print("Starter validation errors found:")
for error in starter_validation_errors:
print(error)
else:
print("Starter validation passed.")
# %%
print(sum(synthetic_df['GS']))
# %%
# Save to CSV
goals_df = goals_df.drop(columns=["Generated_by_PlayerID", "Performed_in_MatchID"])
assists_df = assists_df.drop(columns=["Generated_by_PlayerID", "Performed_in_MatchID"])
shots_df = shots_df.drop(columns=["Generated_by_PlayerID", "Performed_in_MatchID"])
#starter_df = starter_df.drop(columns=["MatchID"])
person_data = person_data.drop(columns=["PlayerID"])
# Save to CSV
# %%
#get games started by player
#starter_df = pd.read_csv("starter.csv")
# Get the number of games started by each player
starter_count = starter_df["PlayerID"].value_counts()
print((starter_count))
# %%
#get assists for playerid p1
print(assists_df.loc[assists_df["Generated_by_PlayerID"] == "P11"])
# %%
#get all actions performed in match M2
print(actions_df.loc[actions_df["Performed_in_MatchID"] == "M2"])
# %%
#print the length of shots, assits and goals in match M2
print(len(actions_df.loc[actions_df["Performed_in_MatchID"] == "M2"]))
print(len(goals_df.loc[goals_df["Performed_in_MatchID"] == "M2"]))
print(len(assists_df.loc[assists_df["Performed_in_MatchID"] == "M2"]))
print(len(shots_df.loc[shots_df["Performed_in_MatchID"] == "M2"]))
print(goals_df.loc[goals_df["Performed_in_MatchID"] == "M2"])
# %%
#print total goals in match M2
print(goals_df.loc[goals_df["Performed_in_MatchID"] == "M2"].shape[0])
# %%
#print all stats for playerid P35
print(synthetic_df.loc[synthetic_df["PlayerID"] == "P35"])
# %%
import sqlite3
import pandas as pd
# Create an in-memory SQLite database
conn = sqlite3.connect(':memory:')
person_data = pd.read_csv("updatedCSVs/person.csv")
player_data = pd.read_csv("updatedCSVs/player.csv")
actions_df = pd.read_csv("updatedCSVs/action.csv")
goals_df = pd.read_csv("updatedCSVs/goal.csv")
assists_df = pd.read_csv("updatedCSVs/assist.csv")
shots_df = pd.read_csv("updatedCSVs/shot.csv")
starter_df = pd.read_csv("updatedCSVs/starter.csv")
# Load DataFrames into SQLite as tables
person_data.to_sql('Person', conn, index=False, if_exists='replace')
player_data.to_sql('Player', conn, index=False, if_exists='replace')
actions_df.to_sql('Actions', conn, index=False, if_exists='replace')
goals_df.to_sql('Goals', conn, index=False, if_exists='replace')
assists_df.to_sql('Assists', conn, index=False, if_exists='replace')
shots_df.to_sql('Shots', conn, index=False, if_exists='replace')
starter_df.to_sql('Started', conn, index=False, if_exists='replace')
# Example: Display all tables and their first rows
print("\nTables loaded into SQLite:")
for table_name in ['Person', 'Started','Player', 'Actions', 'Goals', 'Assists', 'Shots']:
query = f"SELECT * FROM {table_name} LIMIT 5"
print(f"\n{table_name}:")
print(pd.read_sql_query(query, conn))
# Example SQL Query: Retrieve player details for all goals
query = """
SELECT
Player.PlayerID,
Person.Name,
COUNT(DISTINCT Shots.ShotID) AS Total_Shots,
COUNT(DISTINCT StarterActions.Performed_in_MatchID) AS Total_Games_Started,
COUNT(DISTINCT Goals.GoalID) AS Total_Goals,
COUNT(DISTINCT Assists.AssistID) AS Total_Assists
FROM Player
JOIN Person ON Player.Email = Person.Email
LEFT JOIN Actions ON Player.PlayerID = Actions.Generated_by_PlayerID
LEFT JOIN Goals ON Actions.ActionID = Goals.ActionID
LEFT JOIN Shots ON Actions.ActionID = Shots.ActionID
LEFT JOIN Assists ON Actions.ActionID = Assists.ActionID
LEFT JOIN Started ON Started.ActionID = Actions.ActionID
LEFT JOIN Actions AS StarterActions ON Started.ActionID = StarterActions.ActionID
GROUP BY Player.PlayerID, Person.Name
"""
# Execute the query and load into a DataFrame
player_stats_df = pd.read_sql_query(query, conn)
# Save the query results to a CSV
#player_stats_df.to_csv("post_sql.csv", index=False)
print("\nPlayer Details for All Goals:")
print(player_stats_df)
# Close the connection when done
conn.close()
# %%
player_stats_df
# %%
sum(player_stats_df['Total_Games_Started'])
# %%
player_stats_df.to_csv("player_stats_1.csv", index=False)
# %%Model Features:
- Performance Metrics: Goals, assists, minutes played, ratings
- Derived Features: Goals/assists per 90 minutes, consistency scores
- Ensemble Method: Random Forest with 100 estimators
- Cross-Validation: 5-fold validation for robust evaluation
Synthetic and Real Distributions Compared
Machine Learning Pipeline
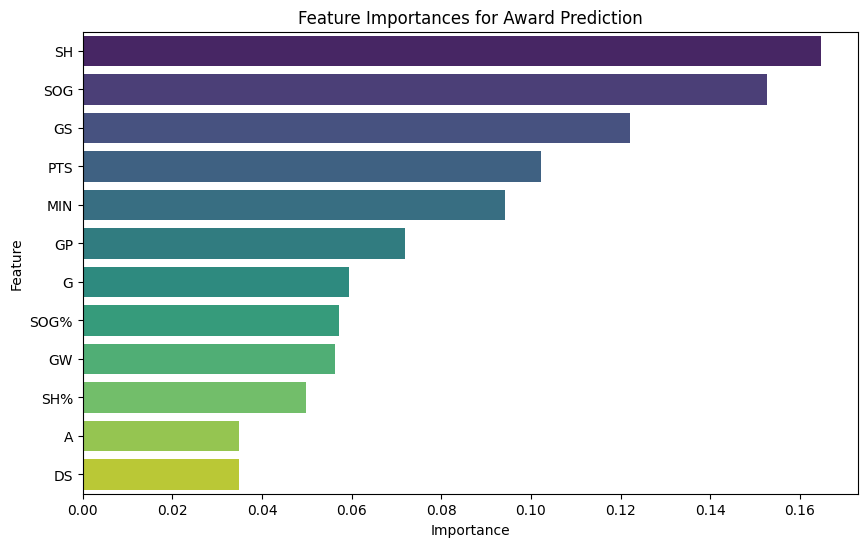
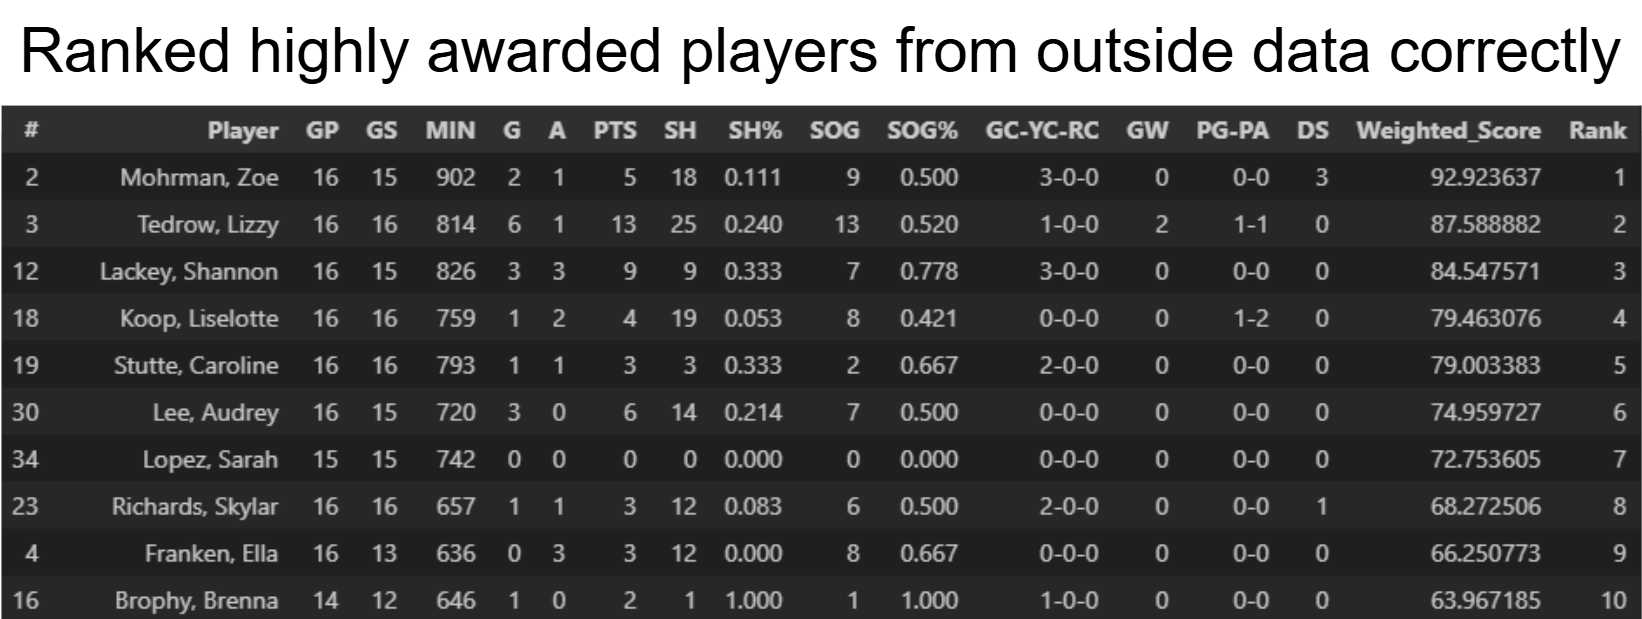
To present how the database can generate even more value through the use of machine learning, I developed a simple ranking system model that to give a non bias ranking of players based on performance stats. This model could assist in award decisions such as MVP or give insight to who might the team want to start in future games. It was trained on historical data to extract which features influence award decisions the most. The model was then tested on other seasons and teams to validate its accuracy.
# %%
import pandas as pd
# %%
data = pd.read_csv('field_hockey_stats_fixed1.csv')
data
# %%
import pandas as pd
import numpy as np
from sklearn.ensemble import RandomForestClassifier
from sklearn.model_selection import train_test_split
from sklearn.metrics import classification_report, confusion_matrix
import seaborn as sns
import matplotlib.pyplot as plt
# Select features and target
features = ["GP", "GS", "MIN", "G", "A", "PTS", "SH", "SH%", "SOG", "SOG%", "GW", "DS"]
target = "Awards"
# Ensure numeric columns are correctly typed
data[features + [target]] = data[features + [target]].apply(pd.to_numeric, errors="coerce")
# Split the data into training and testing sets (50% split)
X = data[features]
y = data[target]
X_train, X_test, y_train, y_test = train_test_split(X, y, test_size=0.5, random_state=42)
# Train a Random Forest Classifier
model = RandomForestClassifier(random_state=42)
model.fit(X_train, y_train)
# Evaluate the model
y_pred = model.predict(X_test)
print("\nClassification Report:")
print(classification_report(y_test, y_pred))
# Confusion Matrix
conf_matrix = confusion_matrix(y_test, y_pred)
plt.figure(figsize=(8, 6))
sns.heatmap(conf_matrix, annot=True, fmt="d", cmap="Blues", xticklabels=np.unique(y), yticklabels=np.unique(y))
plt.xlabel("Predicted")
plt.ylabel("Actual")
plt.title("Confusion Matrix")
plt.show()
# Feature Importance
feature_importances = pd.DataFrame({
"Feature": features,
"Importance": model.feature_importances_
}).sort_values(by="Importance", ascending=False)
print("\nFeature Importances:")
print(feature_importances)
# Plot feature importance
plt.figure(figsize=(10, 6))
sns.barplot(x="Importance", y="Feature", data=feature_importances, palette="viridis")
plt.title("Feature Importances for Award Prediction")
plt.show()
# %%
import pandas as pd
import numpy as np
# Load the data
data = pd.read_csv("field_hockey_stats_fixed1.csv")
# Ensure numeric columns are correctly typed
features = ["GP", "GS", "MIN", "G", "A", "PTS", "SH", "SH%", "SOG", "SOG%"]
data[features + ["Year"]] = data[features + ["Year"]].apply(pd.to_numeric, errors="coerce")
# Feature importances
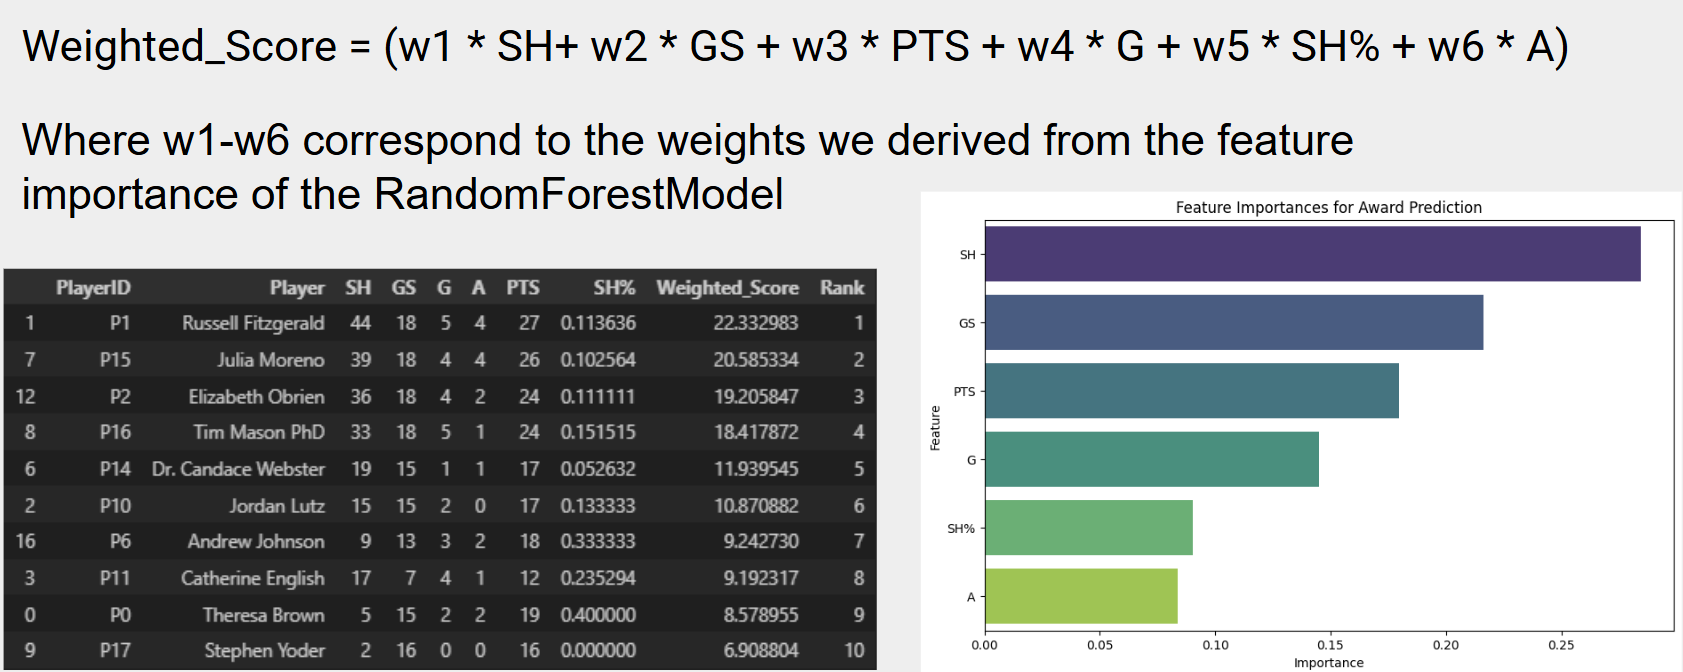
feature_importances = {
"SH": 0.164682,
"SOG": 0.152664,
"GS": 0.122096,
"PTS": 0.102293,
"MIN": 0.094130,
"GP": 0.071847,
"G": 0.059313,
"SOG%": 0.057186,
"SH%": 0.049764,
"A": 0.034925,
}
# Calculate weighted scores
data["Weighted_Score"] = sum(
data[feature] * weight for feature, weight in feature_importances.items()
)
# Rank players within each year
data["Yearly_Rank"] = data.groupby("Year")["Weighted_Score"].rank(ascending=False).astype(int)
# Sort by year and rank
ranked_players = data.sort_values(["Year", "Yearly_Rank"])
# Display top players for each year
#print("\nTop Players by Year:")
#print(ranked_players[["Year", "Player", "Weighted_Score", "Yearly_Rank"]]) # Show top 20
# Show top 20 players for year 2024
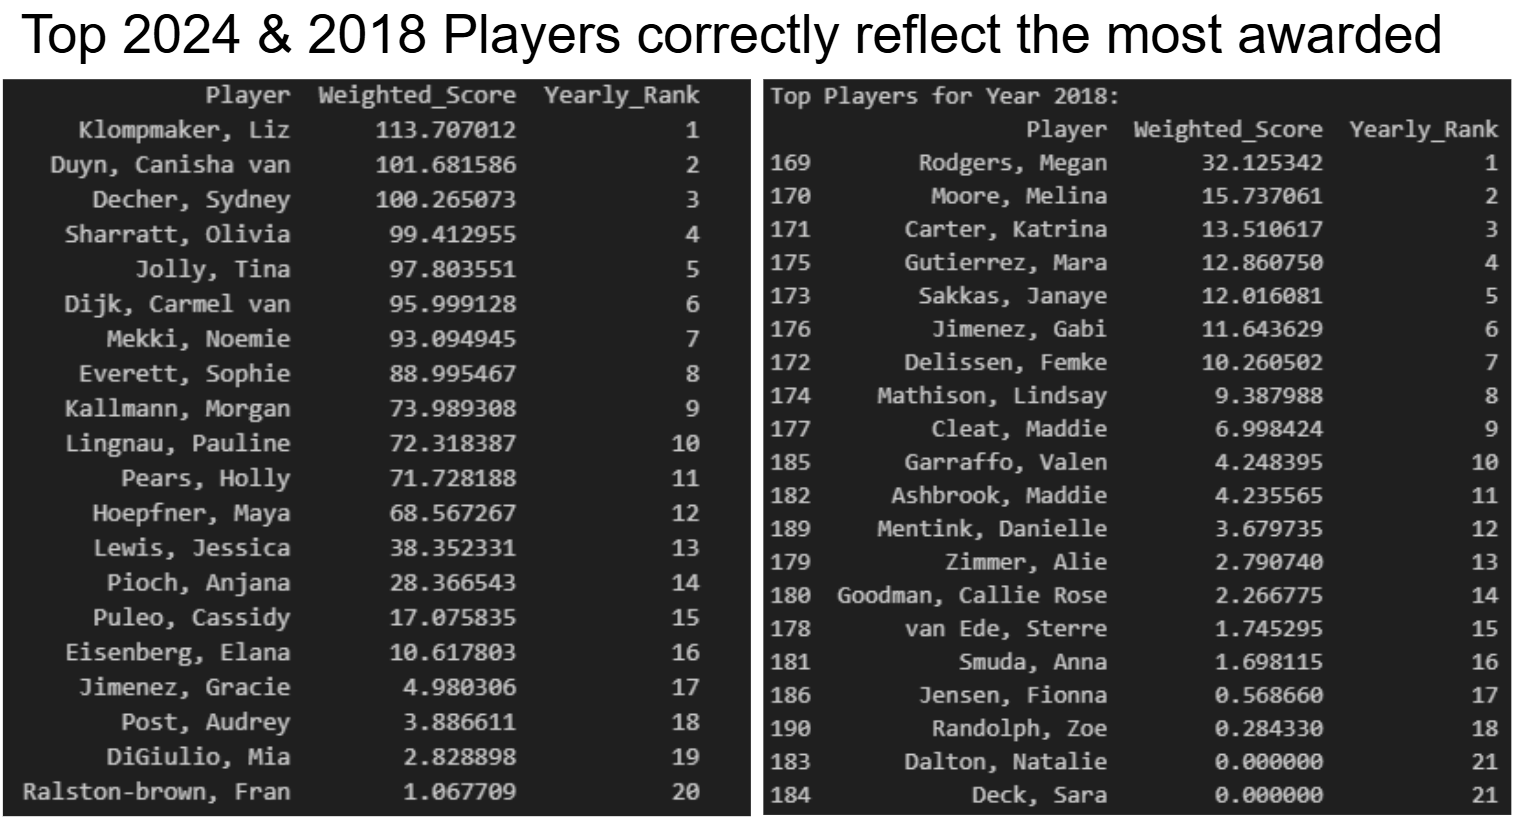
print("\nTop Players for Year 2024:")
print(ranked_players[ranked_players["Year"] == 2024][["Player", "Weighted_Score", "Yearly_Rank"]].head(20))Model Features:
- Performance Metrics: Goals, assists, minutes played, ratings
- Derived Features: Goals/assists per 90 minutes, consistency scores
- Ensemble Method: Random Forest with 100 estimators
- Cross-Validation: 5-fold validation for robust evaluation
Model Visuals and Insights
Results & Impact
Our client Cal Club Field Hockey was left with a functional database replacing traditional spreadsheet and paper data keeping. The database now allows for efficient data entry, retrieval, and analysis of player statistics, along with having tables set up for commercial purposes such as granular tracking of merch sales. The machine learning model also provides a new avenue for player evaluation and recognition, lessening potential biases that could present themselves during award reception.